

"Connecting Hermes Agent to Your Tools and APIs" built a single-user Hermes gateway against GitHub, and "Multi-User Access Control for AI Agents on Hermes" proved that the same gateway holds up with more than one identity. Both used GitHub, a connector that was already sitting in Scalekit's catalog. That's the easy case. The moment your team needs Hermes to touch something that isn't in Scalekit's catalog, an internal admin panel, a proprietary system, or in this case, a real, live Grafana Cloud instance, the pattern changes.
This post covers why that gap is permanent, not something a bigger catalog eventually fixes, then builds a real custom connector for Grafana end to end: creating the connector from the dashboard and from the management API, wiring up the connection and authorizing it, discovering the tool's real MCP surface, and calling it for actual data. It also covers the one real decision that matters here, REST connector or MCP connector, and closes with what changes to serve more than one teammate.
The natural assumption is that this is a waiting game: your tool isn't in the catalog yet, but check back next quarter and it probably will be. For an internal tool, that assumption never pays off. Two things keep this gap permanent:
So the real question isn't "will my tool eventually show up?" It's "what's the actual way to wire up the tools that never will," which is what the rest of this post builds.
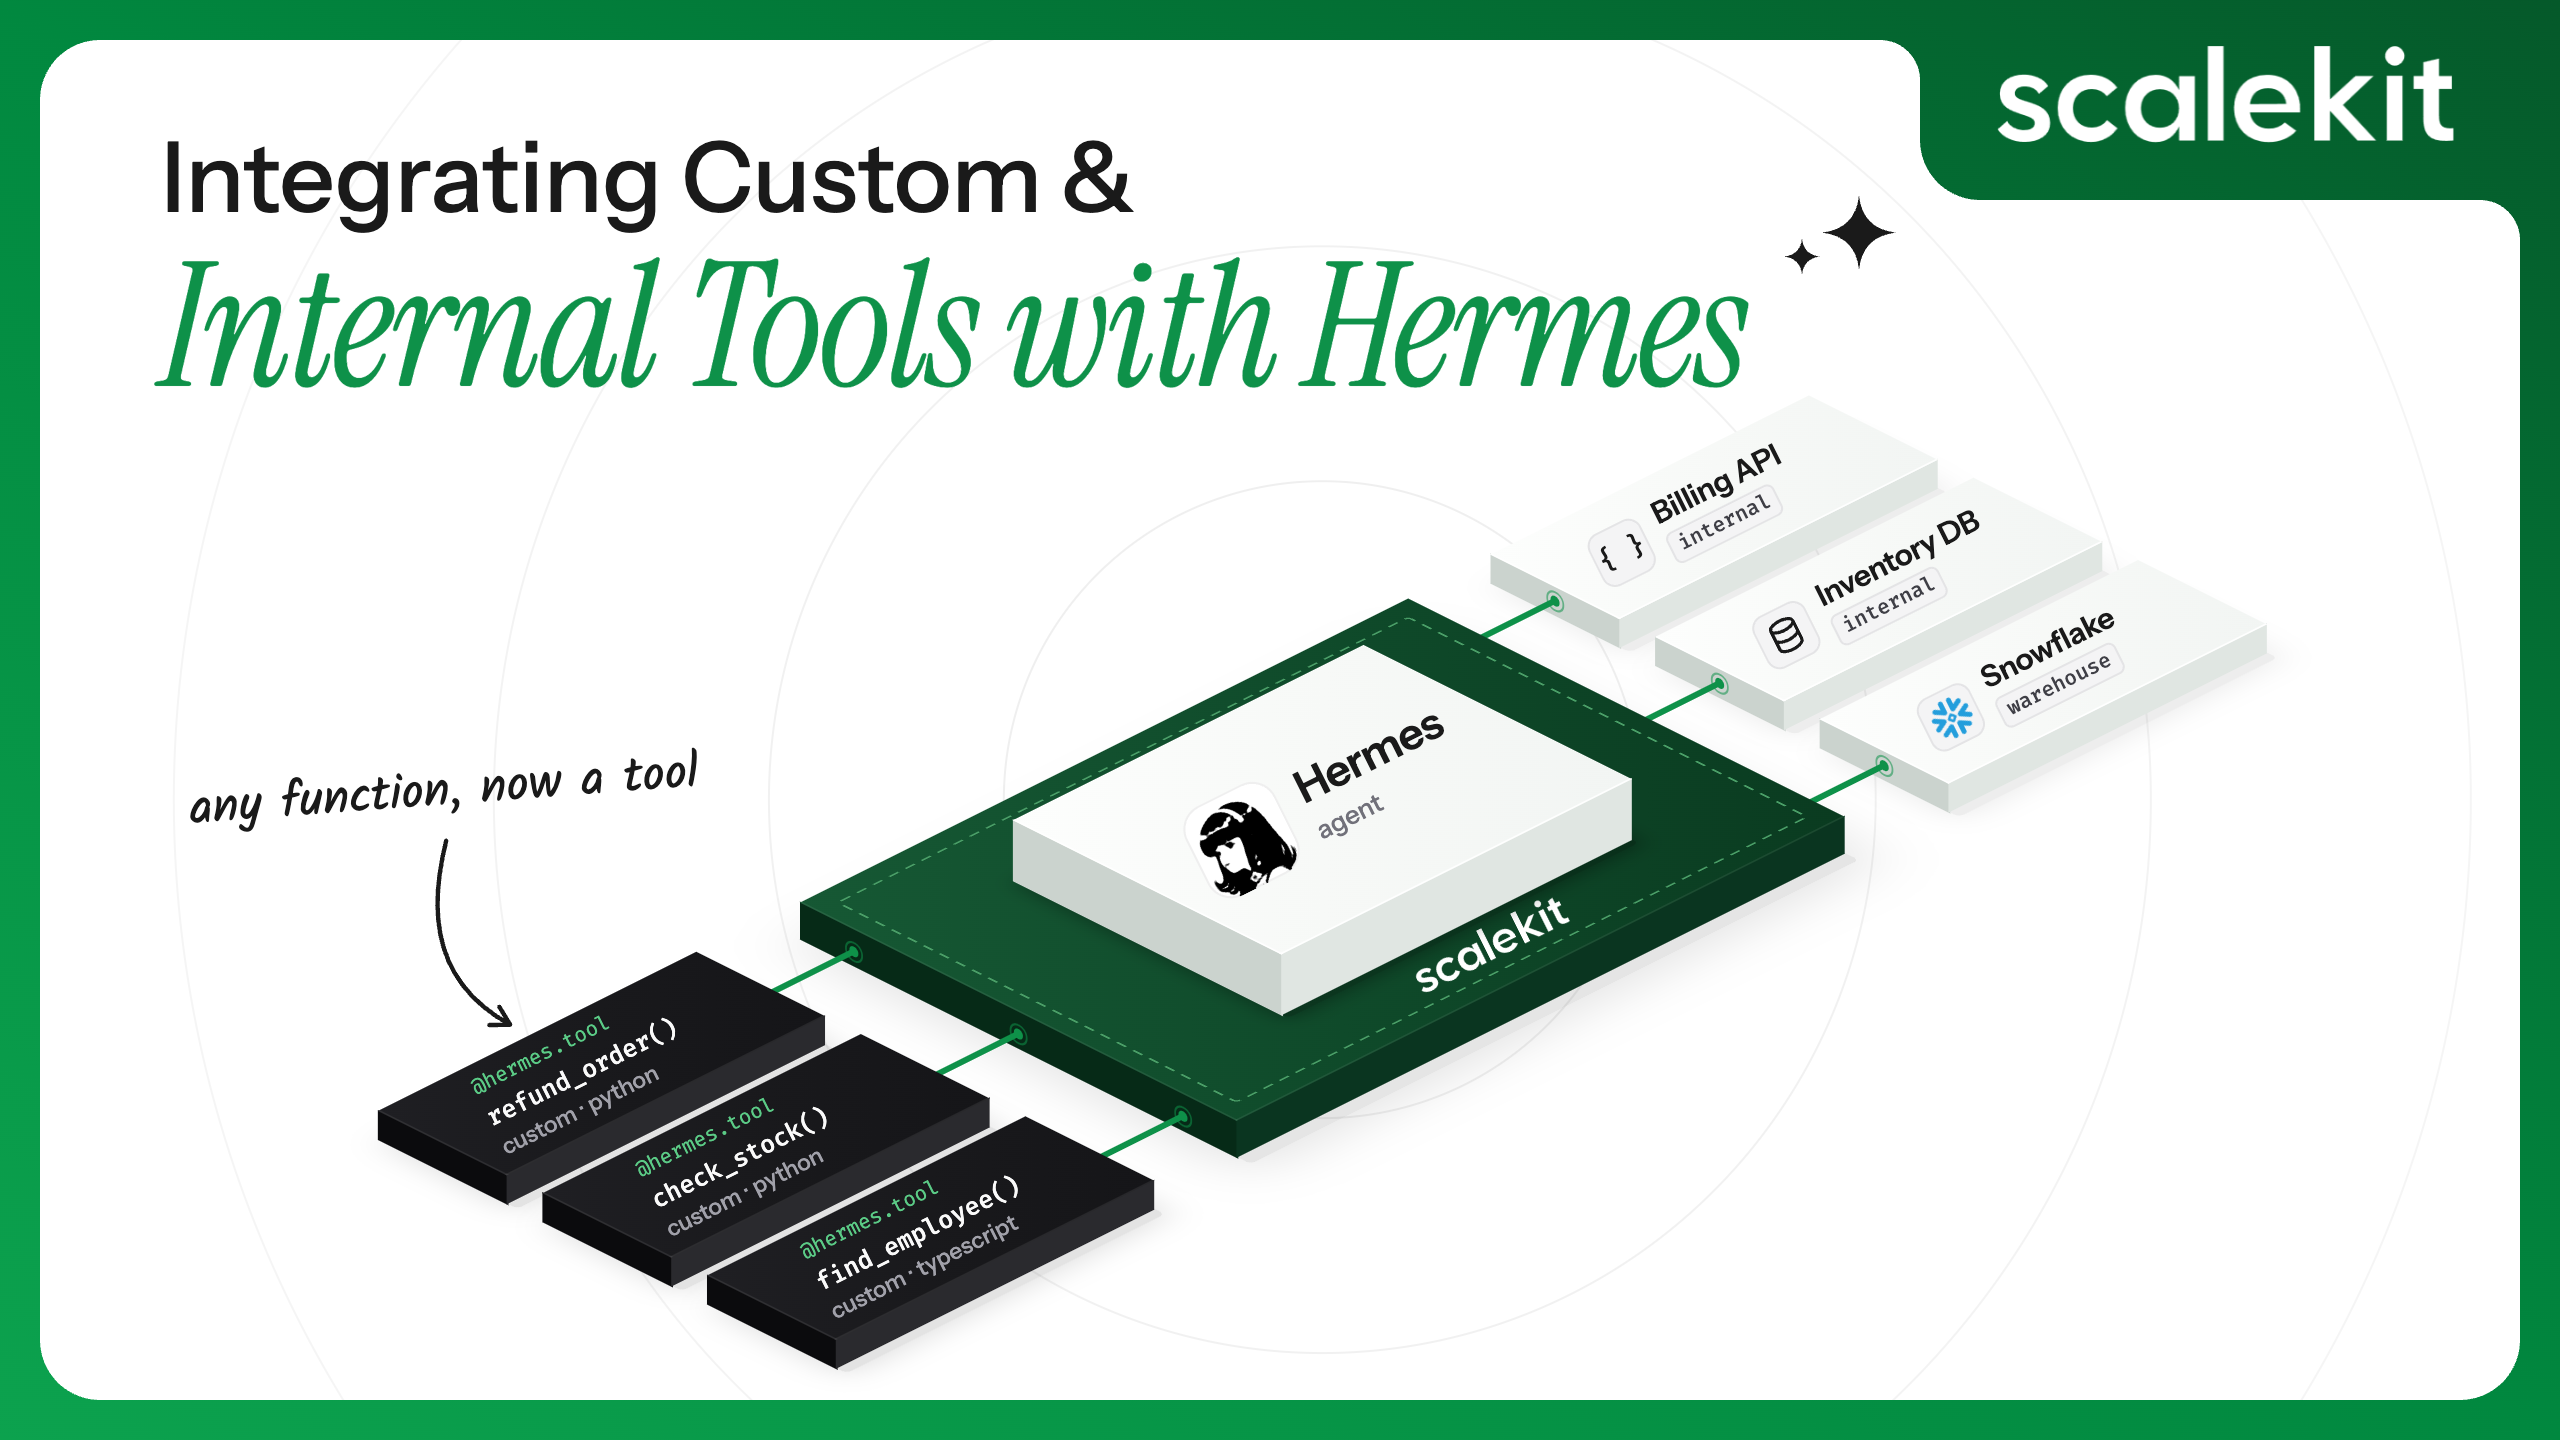
Scalekit AgentKit exposes this as client.actions.providers, with four real methods: create_custom_provider(), update_custom_provider(), list_providers(), delete_custom_provider(). Creating a connector this way plugs it into the exact same downstream model as a built-in one: the same connection, connected account, authorization, and tool-calling flow used for GitHub in Connecting Hermes Agent to Your Tools and APIs and Multi-User Access Control for AI Agents on Hermes post.
A custom provider needs, at minimum, a display_name, a proxy_url (the base URL requests get routed to), and one auth_pattern describing how users authenticate. Four auth types exist: OAUTH, BEARER, API_KEY, NO_AUTH. Which one fits depends entirely on how the target tool itself authenticates, not on preference.
Grafana turned out to be the OAUTH case, for a reason worth explaining before the walkthrough: Grafana Cloud ships its own official MCP server, reachable over HTTPS, that manages its own OAuth exchange. That's different from a plain REST API needing a Bearer token, and picking the right one mattered in practice; more on that below.
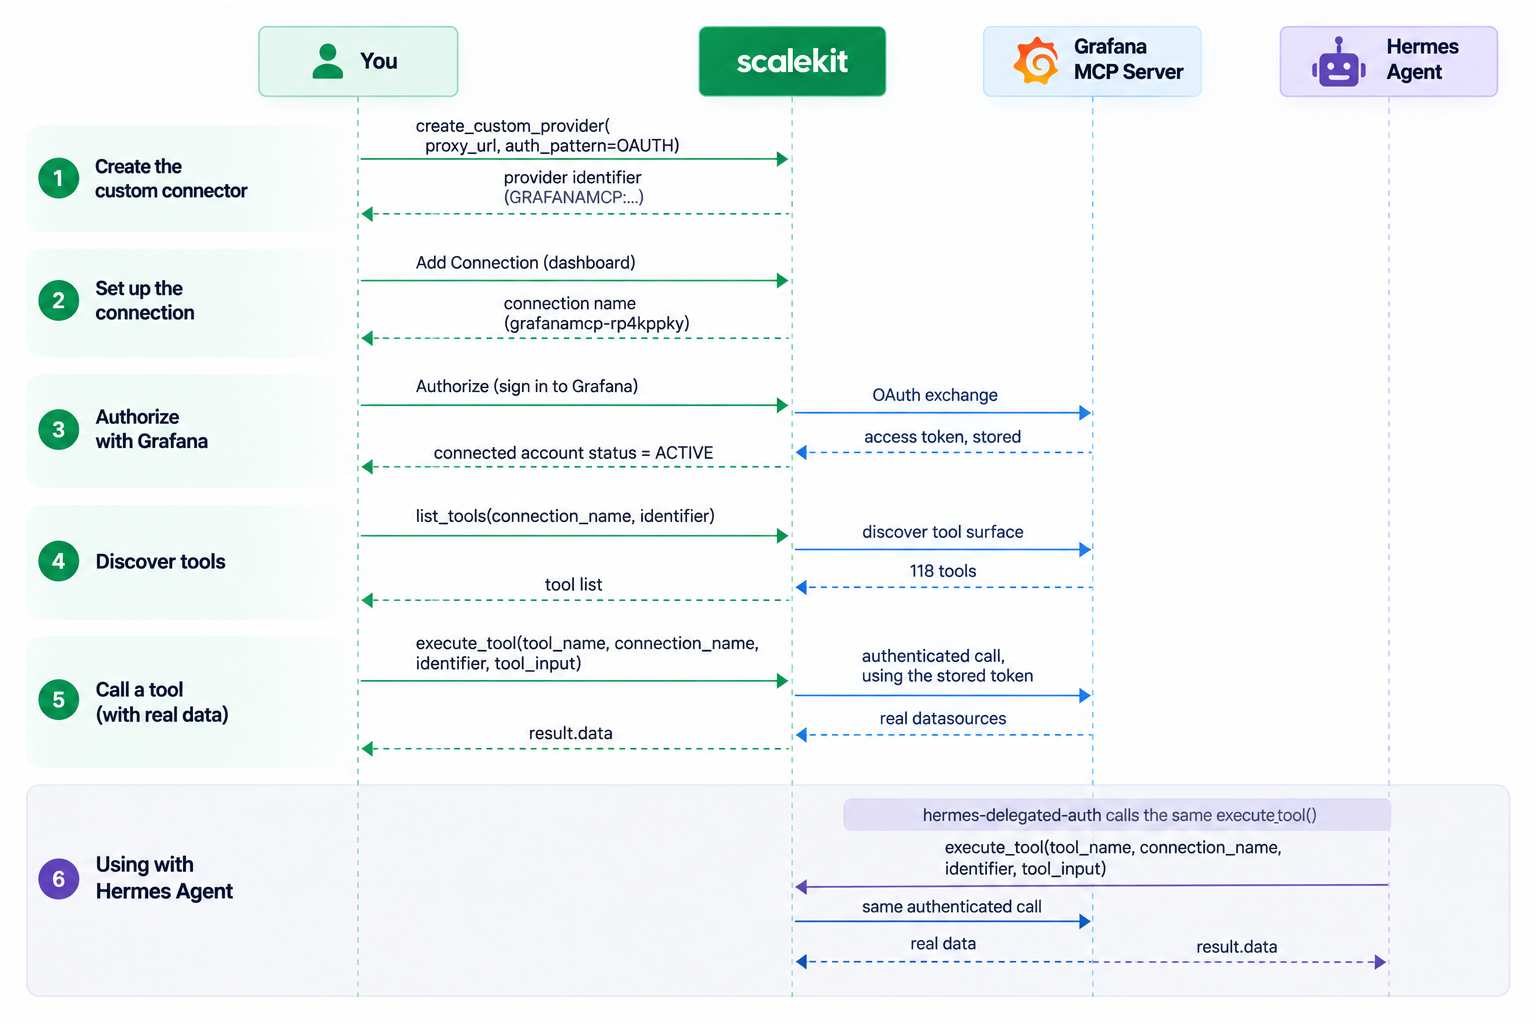
Grafana is the example running through this section, a real Grafana Cloud instance, not a fictional one. Five real calls get from nothing to a working connector, and the last one is the same call Hermes itself ends up making once it's live:
Worth checking before building anything, on your own account too, since catalogs vary. The fastest way: AgentKit → Connectors in the Scalekit dashboard, and search for the tool by name. For this post, that search for "Grafana" across the full catalog, 389 providers at the time of writing, came back empty.

Scripting the same check is also possible, useful if this needs to run as part of a setup script rather than a one-off search:
This is the output after running the script; it shows that Grafana is not found in the connectors:
This script reaches into client.actions.providers._providers_client directly rather than the typed list_providers() wrapper, since one built-in provider on this account (Appcues) has an auth field value the typed wrapper doesn't parse yet. Worth knowing if a scripted catalog scan on your own account needs the same workaround; the dashboard search doesn't hit this issue at all.
Two ways to do this, and both land on the exact same connector underneath: the Scalekit dashboard's guided form, or the management API directly. The dashboard form is the faster path for an MCP connector specifically, since it only asks for what an MCP connector actually needs.
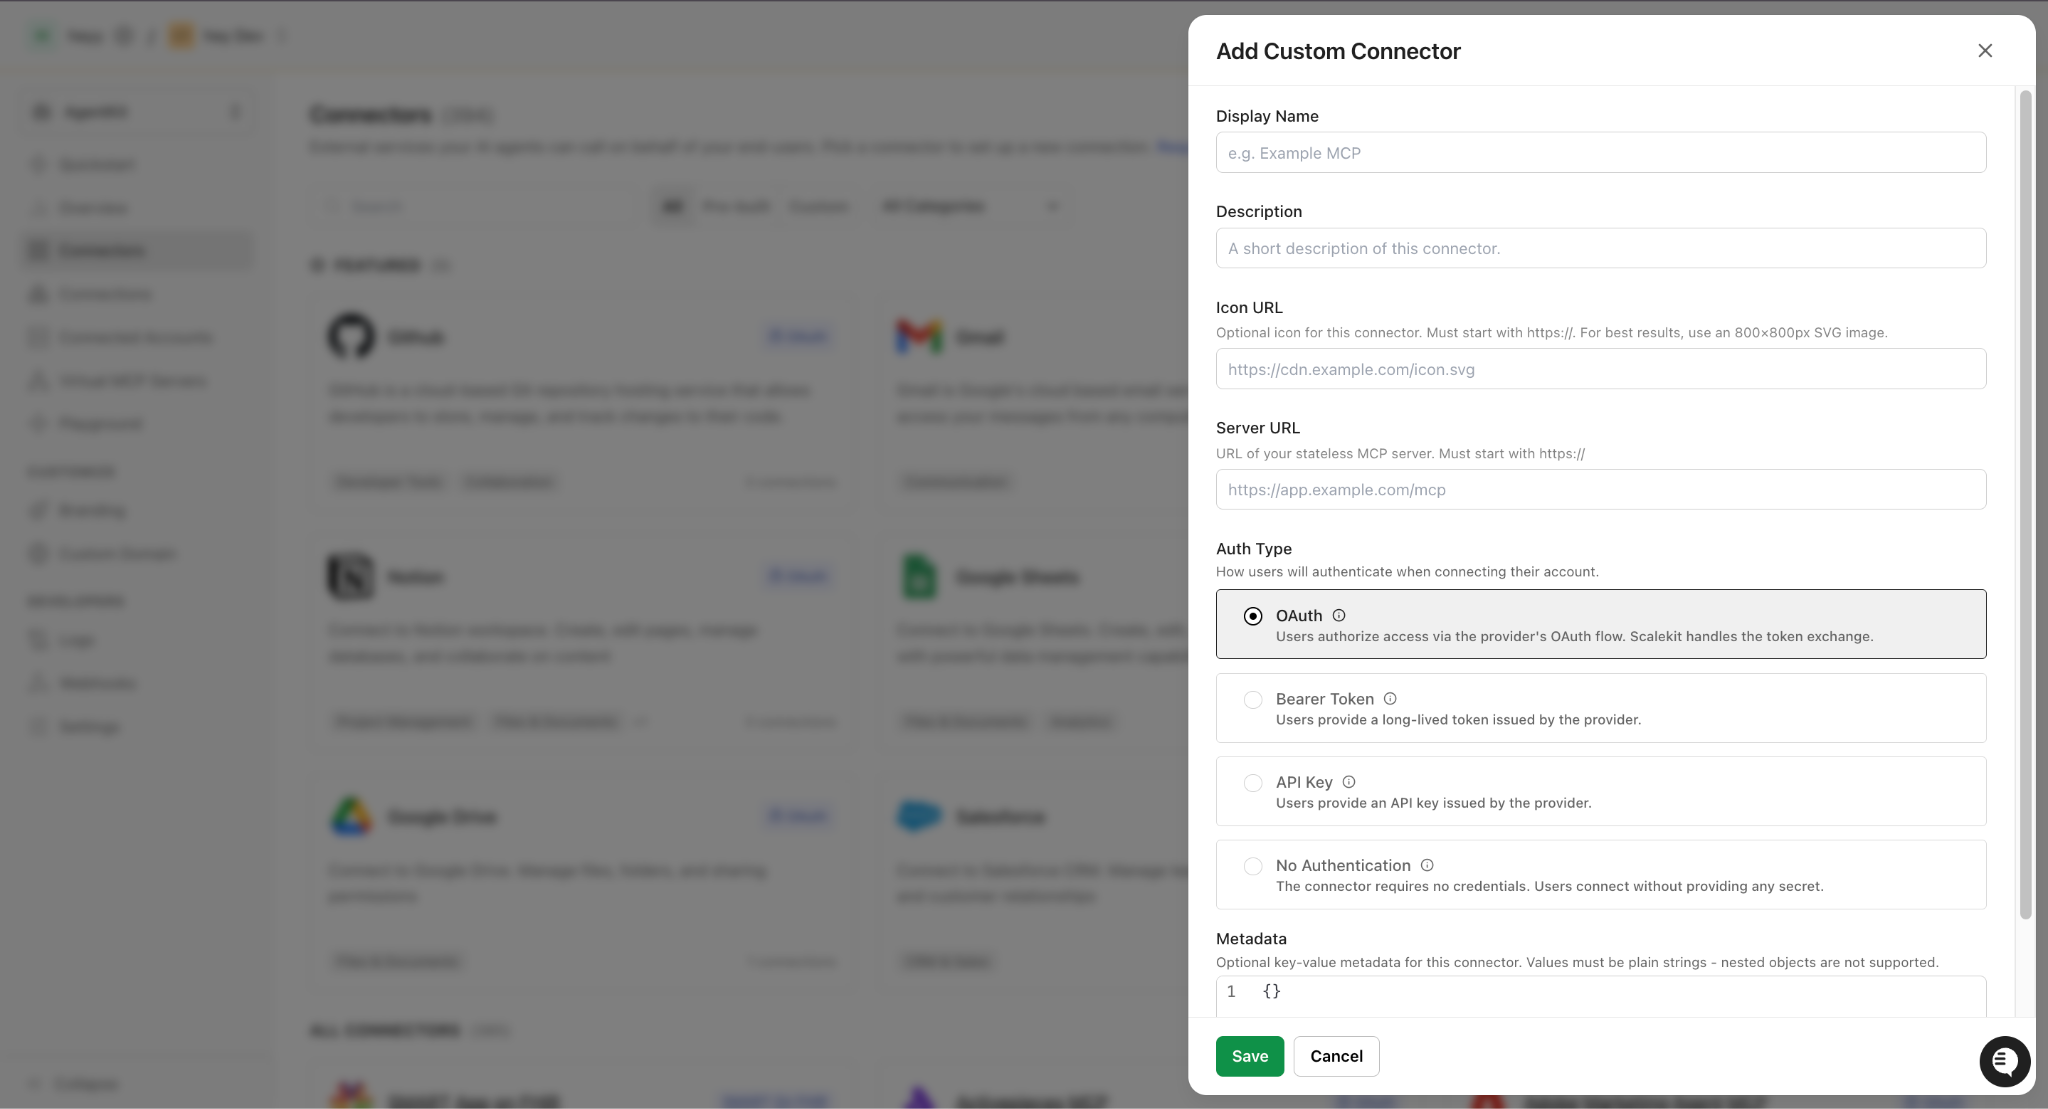
From the dashboard:
From the management API, the same connector, built with the SDK instead of clicking through the form:
One real constraint worth knowing either way: display_name only accepts letters, digits, and spaces, no parentheses, no punctuation, confirmed live by a 400 validation error the first time this was tried through the API with a name that broke that rule.
Creating the connector alone isn't enough. A Connection, the same object created for GitHub in the Connecting Hermes Agent post, has to exist before any connected account or authorization works. Skipping this step fails with connection not found for the given key, confirmed live.
This step happens in the dashboard, the same UI flow used for GitHub earlier in this series:
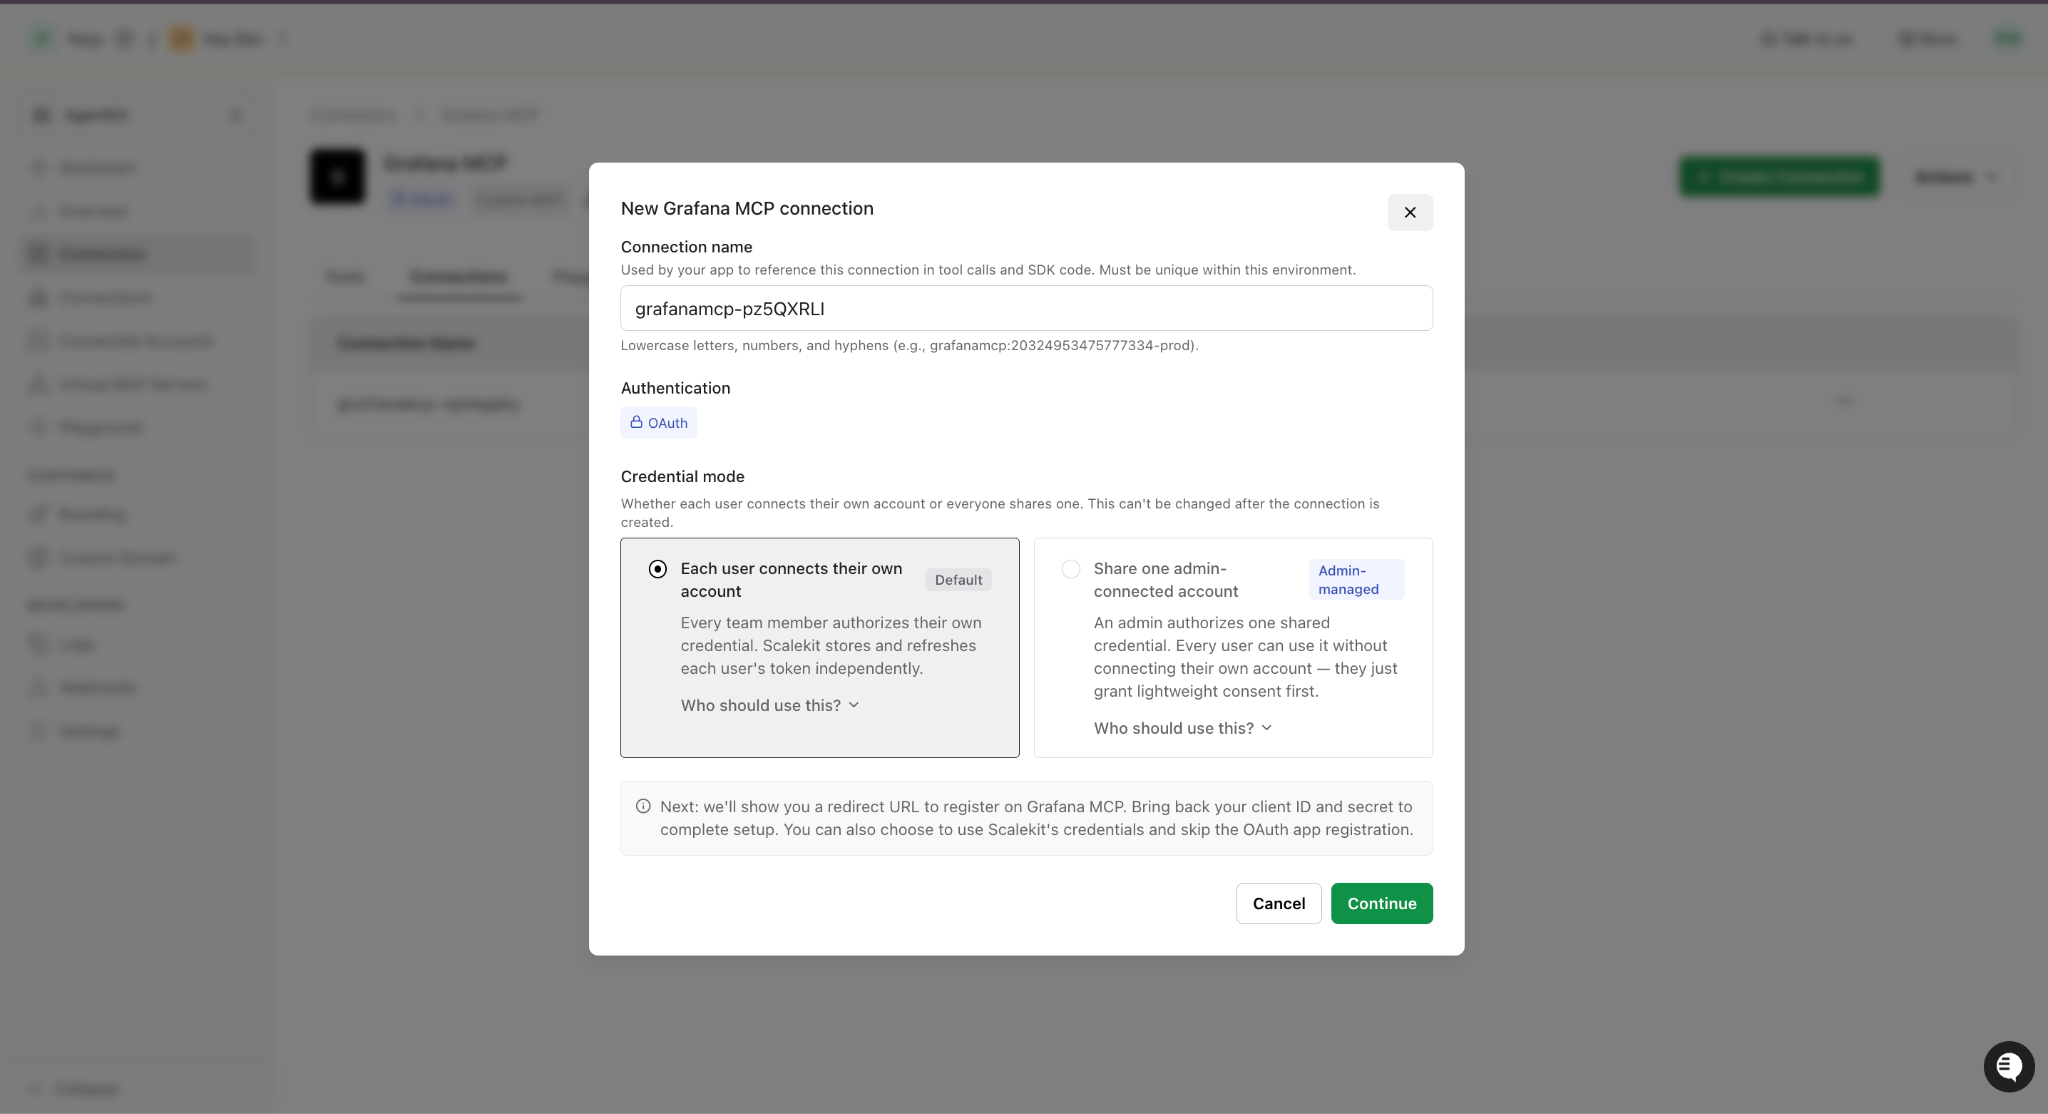
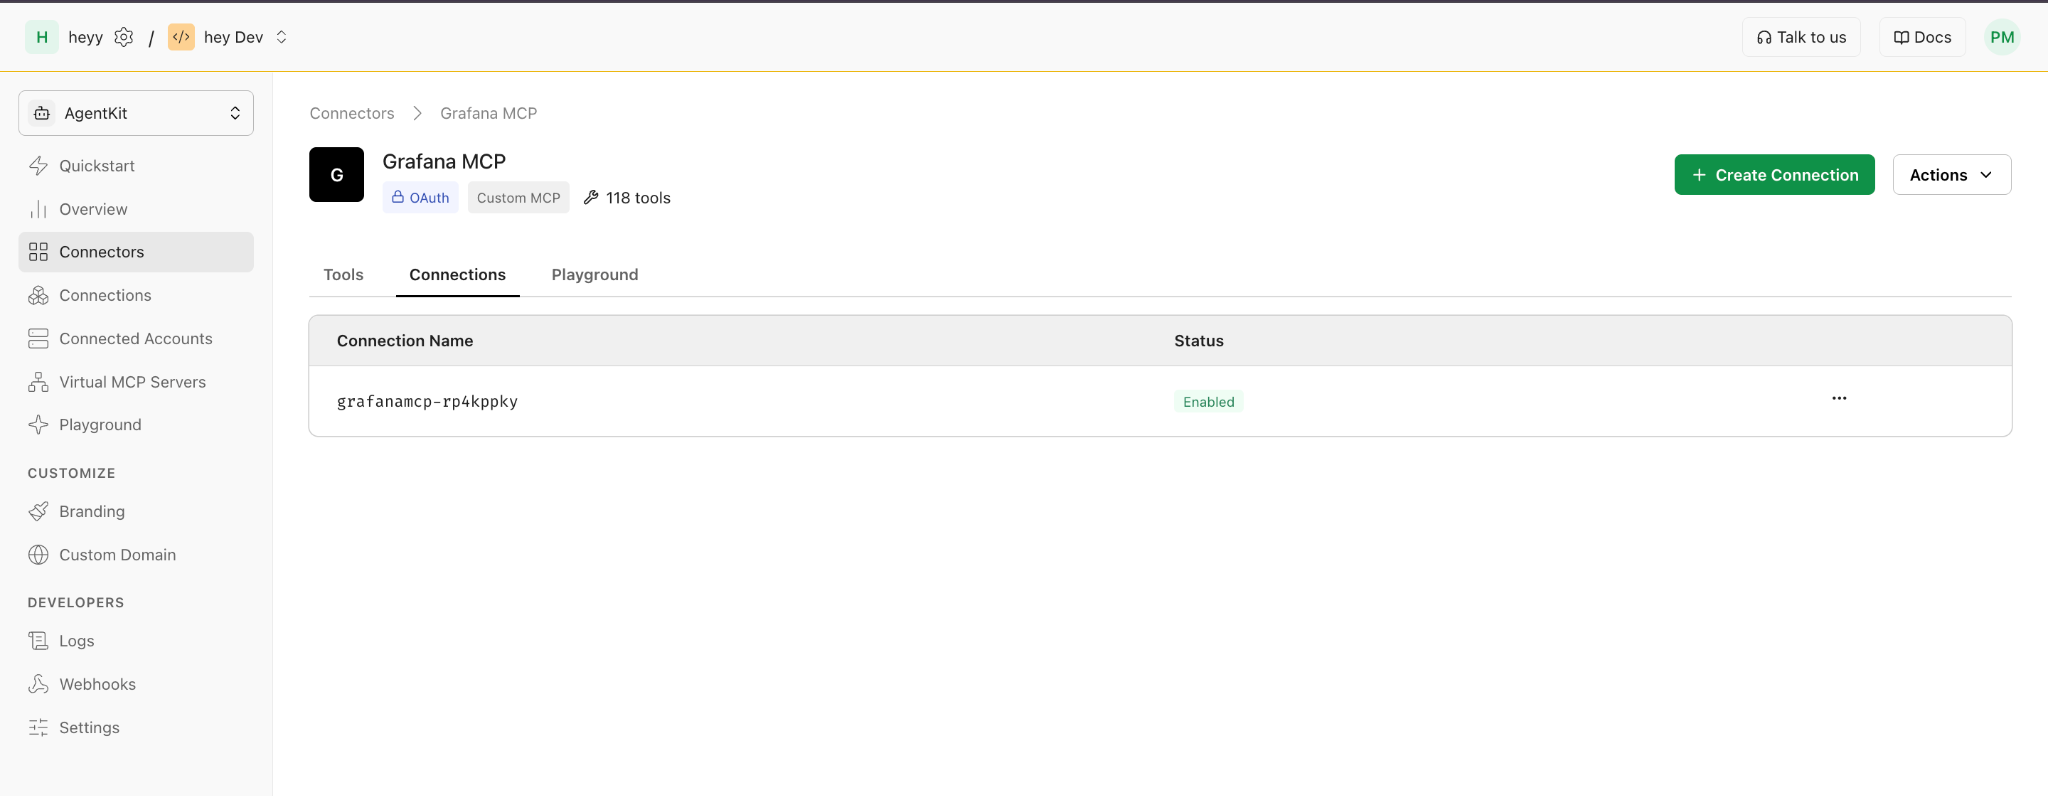
Once that's done, the connection is live, and the same connected account check used throughout this series confirms it from code:
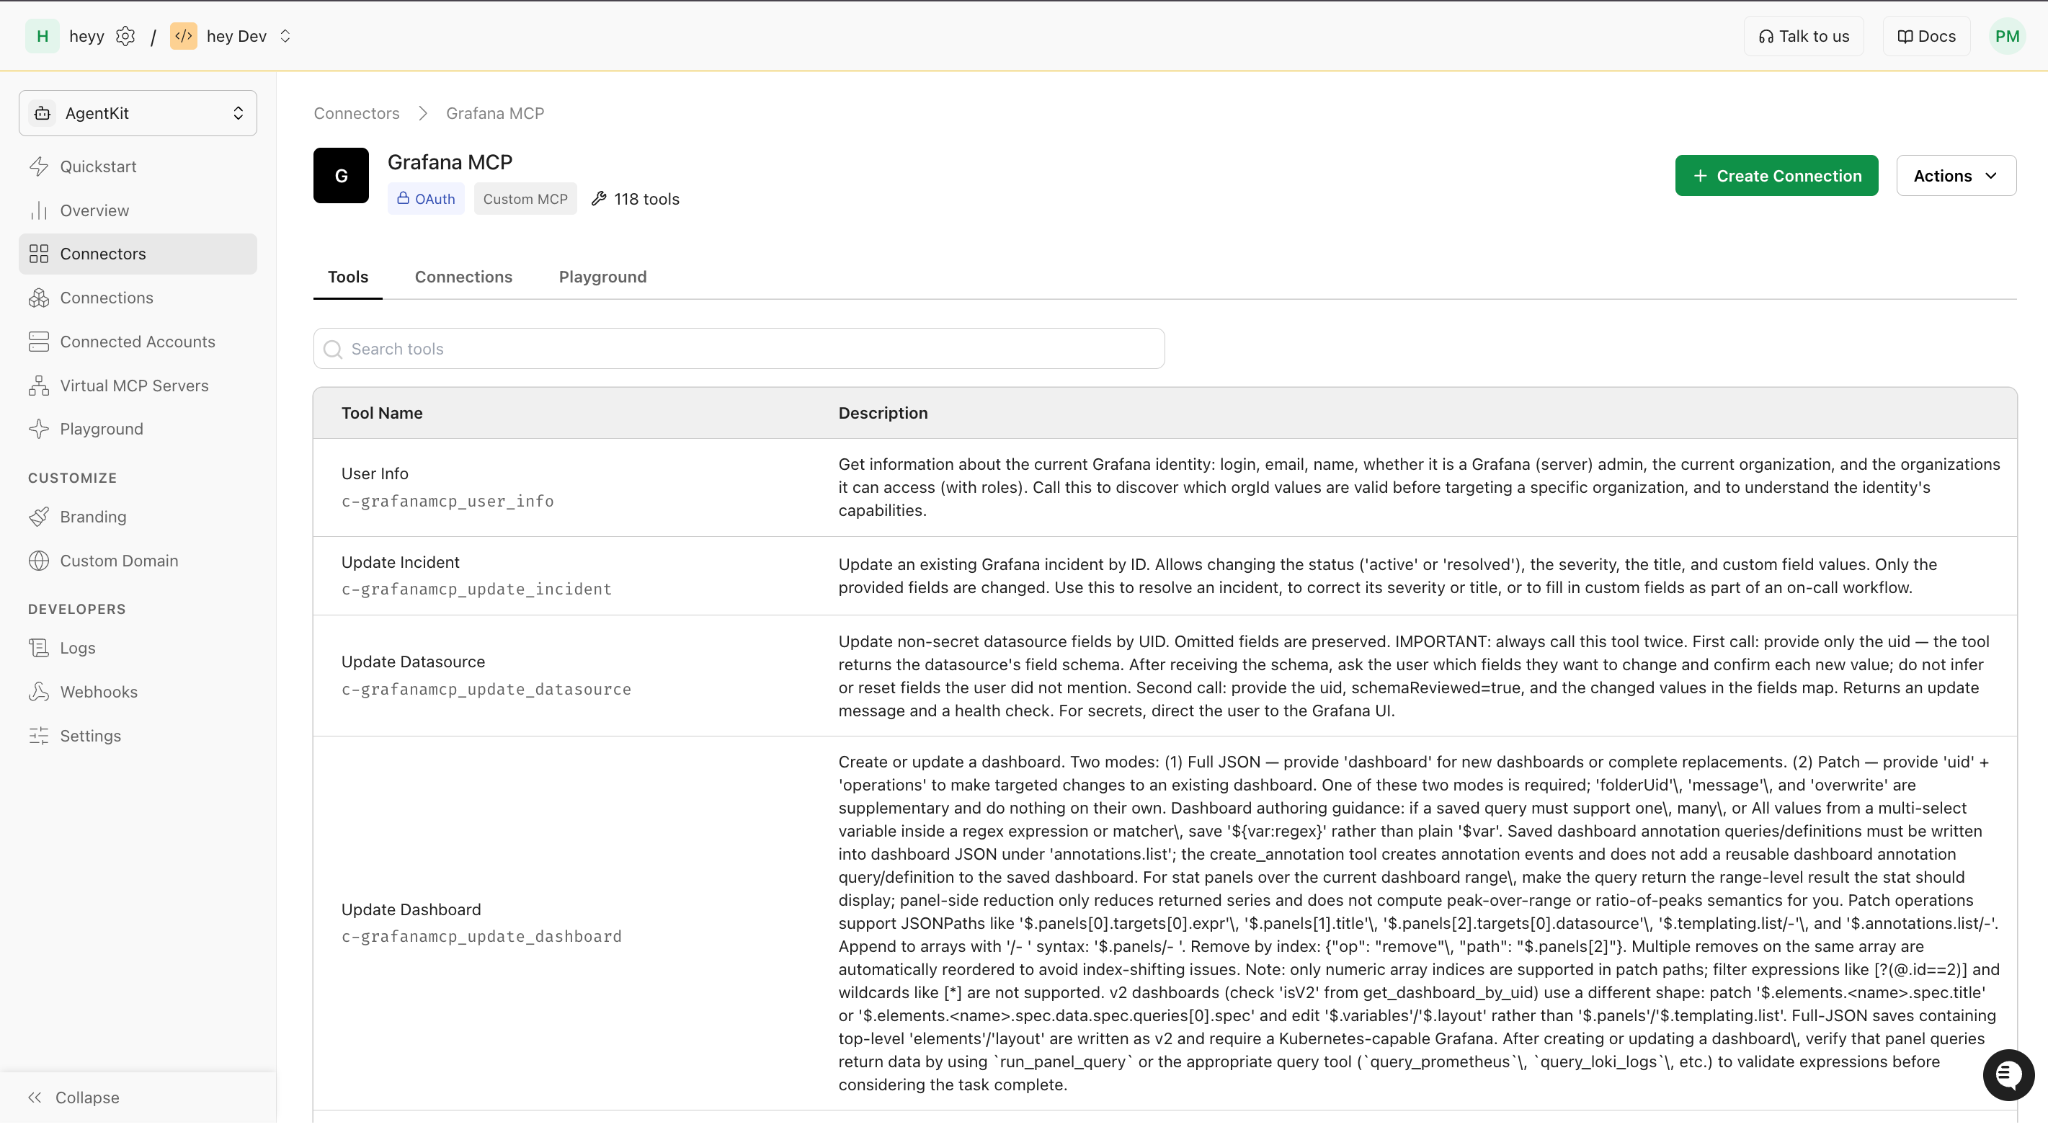
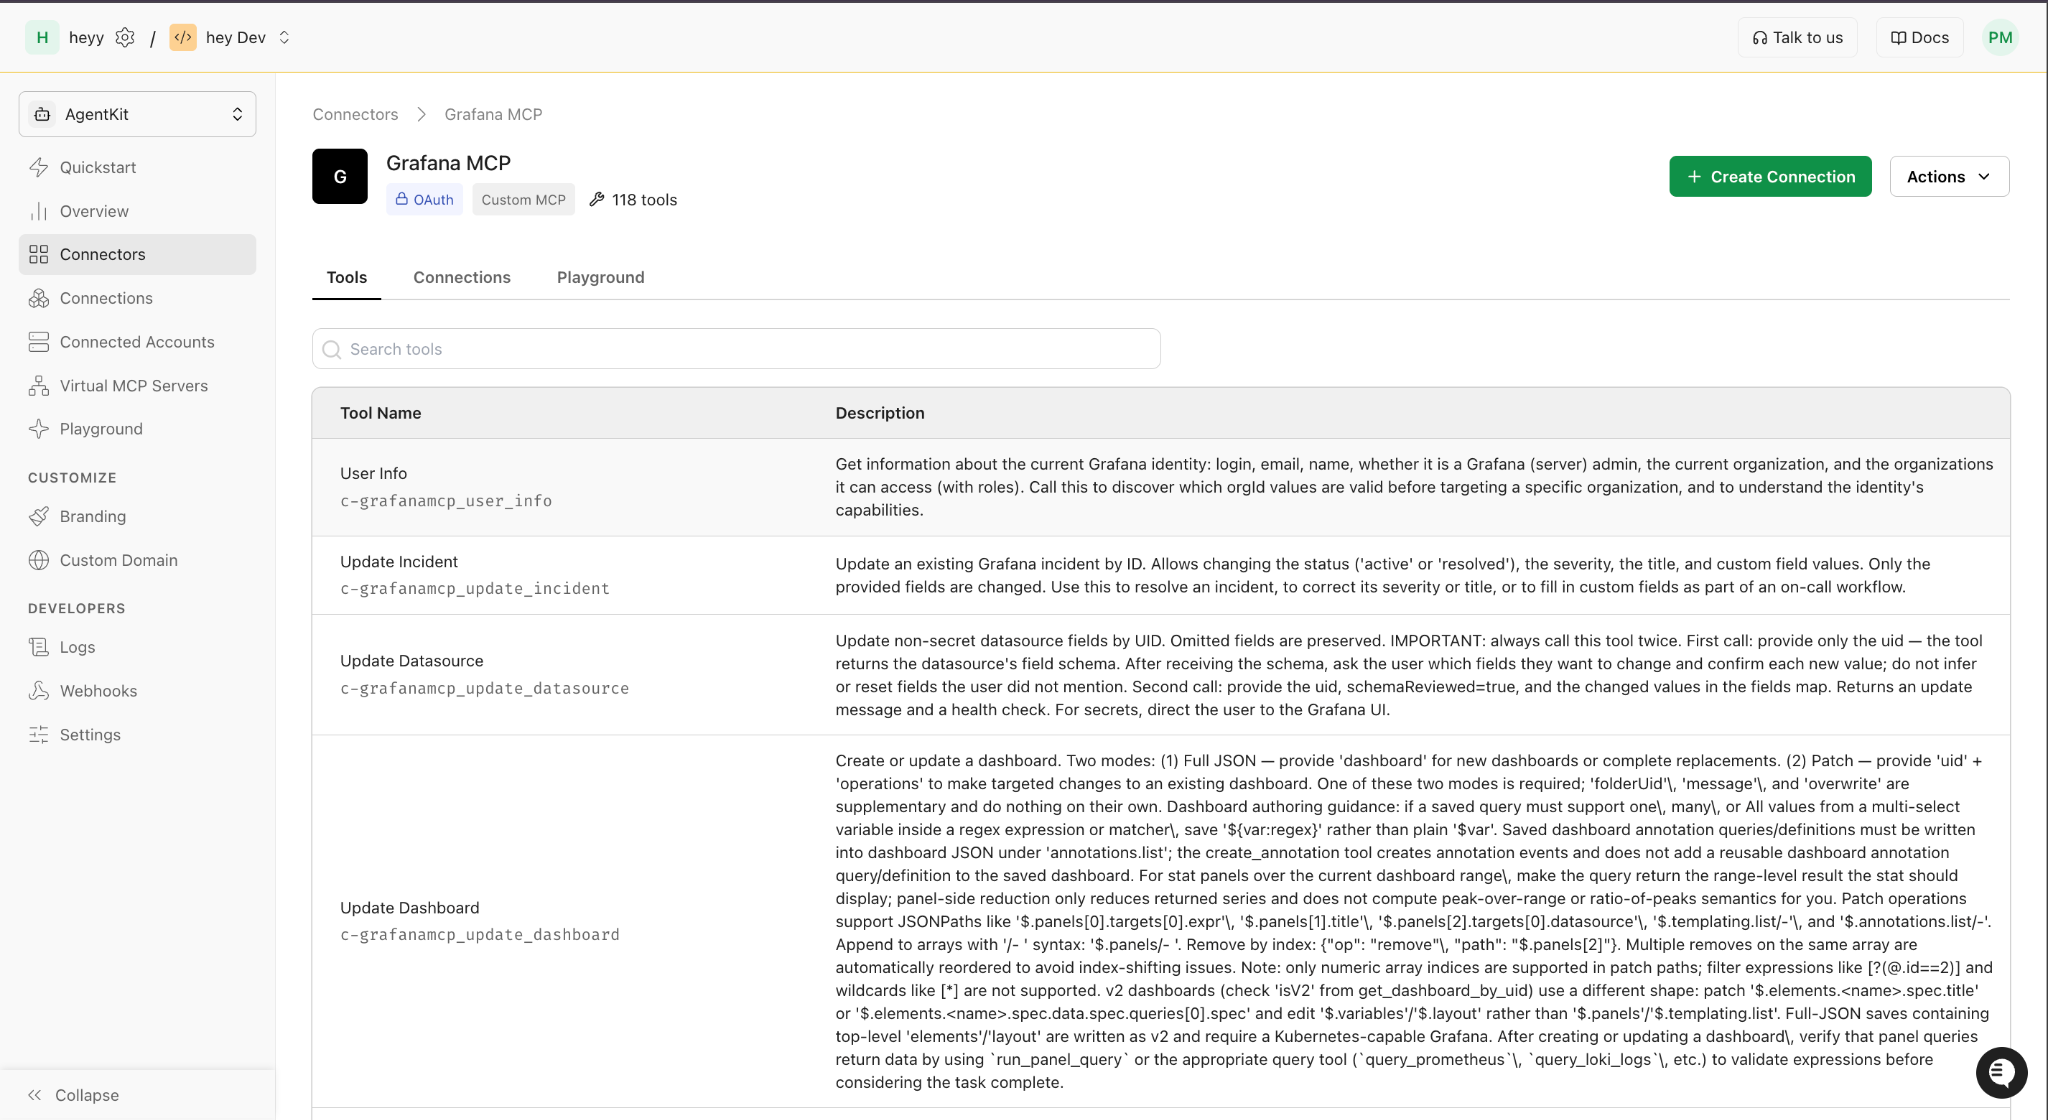
This is the payoff of picking a tool that ships its own MCP server: nothing has to be hand-defined. Scalekit discovers every tool the upstream MCP server exposes.
118 tools are discovered in Grafana's real, published MCP server surface: dashboard search, datasource management, Prometheus and Loki queries, incident management, on-call schedules, alerting rules, and more, all discovered automatically, not manually wired.
This is real output, 12 real datasources, from a real Grafana Cloud instance, named after that instance's own account, trimmed here to three datasources and stripped of each one's numeric id field for readability.
The same call structure was followed by the Connecting Hermes Agent and Multi-User Access Control for AI Agents posts for GitHub tools: tool_name, connection_name, identifier, tool_input, the mechanics don't change once the connector is wired up correctly. What does differ from those posts: an MCP tool's result comes back as a text block inside result.data, not a ready-made dict, so it needs one json.loads() before it's usable.
Everything above ran execute_tool() directly from a Python script, useful for proving the connector works, but Hermes itself is the thing this series is actually about. Scalekit's own docs name three patterns for how Hermes reaches Scalekit at all, and only one of them, Pattern A, hermes-delegated-auth, is the documented default for Hermes. It calls tools with execute_tool(tool_name, connection_name, identifier, tool_input), the same four arguments used throughout this post, and nothing in that call shape is specific to built-in connectors. A custom connector's connection name, grafanamcp-rp4kppky here, works exactly the same way as a built-in one.
In practice, that means installing the skill once:
and then asking Hermes to use the Grafana connector by name, the same way earlier posts in this series asked it to use GitHub:
You: List the Grafana datasources for identifier user_1232.
Hermes resolves user_1232's connected account and calls c-grafanamcp_list_datasources through the skill's own execute_tool wrapper, the identical call this post already ran directly.
The other two patterns the docs describe, Virtual MCP on the host and Virtual MCP in your own app, both mint a Scalekit session token instead. A custom MCP connector like this one works with any of the three, since Scalekit is doing the same connected-account resolution underneath either way, but hermes-delegated-auth is the one built specifically for Hermes and doesn't need a token minted or re-minted at all.
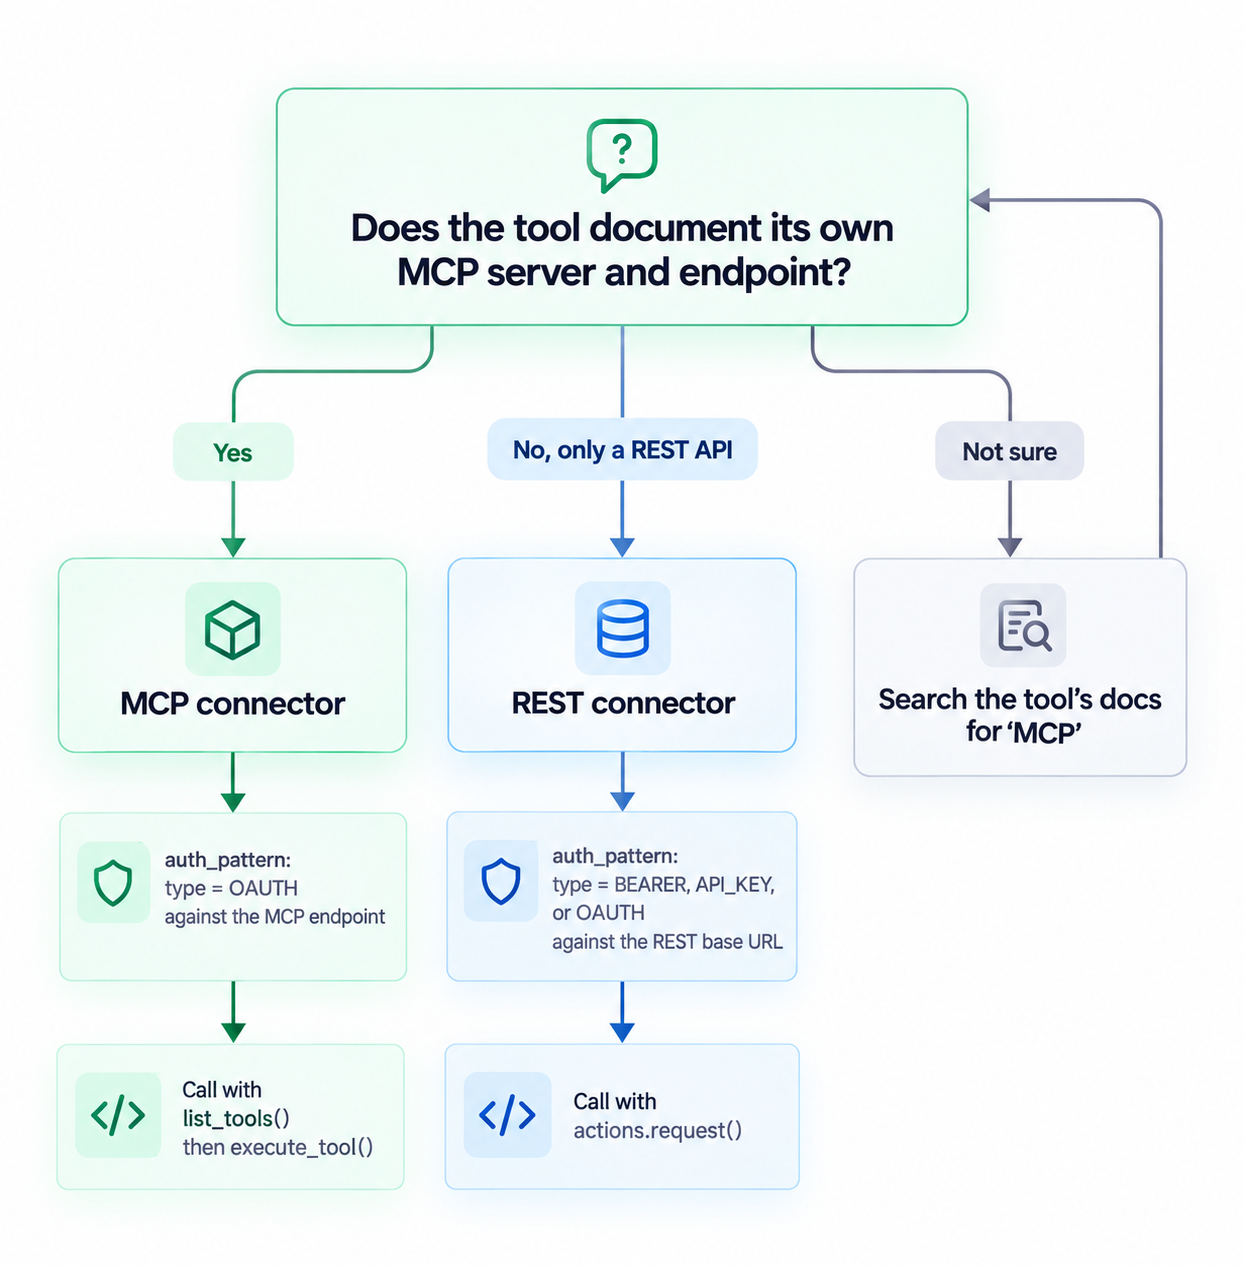
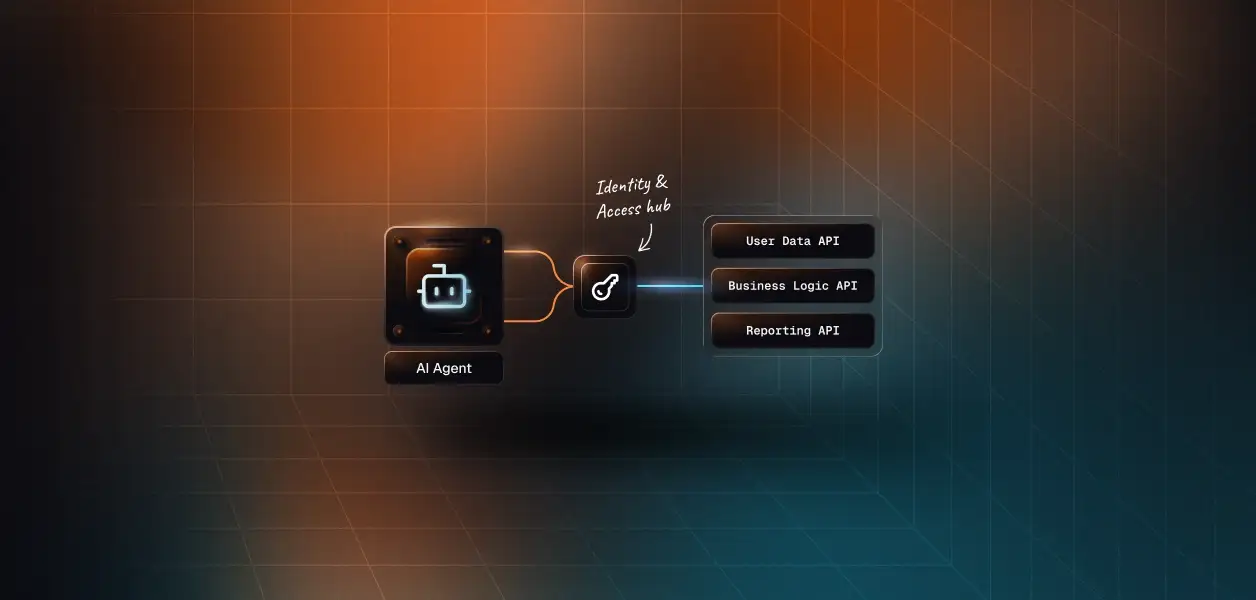
Scalekit supports two ways to call a custom connector once it's created: via Tool Proxy (actions.request()) for REST API connectors, or via MCP tool calling for MCP connectors. Both are real, documented, fully supported paths.
What decides between them is whether the target tool ships its own MCP server, not how it authenticates. Scalekit's dashboard makes this explicit: the guided form for MCP connectors asks for "the base URL of the MCP server," and Scalekit connects to stateless MCP servers only, not arbitrary REST APIs run through that form. A plain REST API needs the other shape, even with the exact same auth type.
Before building either one, check:
Grafana is the MCP case: Grafana Cloud ships its own official MCP server, reachable over OAuth, exactly the walkthrough above. Getting this check wrong means rebuilding the connector from scratch under the other shape, worth the two minutes to confirm first. To understand more about when MCP and REST APIs each make sense, see the difference between MCP and APIs.
Nothing about the mechanism changes; the same pattern from multi-user identity architecture applies directly. Each teammate authorizes their own connected account against the same connection:
Each identity gets its own token, scoped independently, with the same isolation model that per-user JWT claims comparison demonstrates. Choosing per-user credential mode when the connection is created is what makes this possible; the org-wide alternative shares one credential across every identifier, which is the right call for something like a read-only dashboard bot, and the wrong call for anything where individual authorization actually matters. For a deeper look at how credential ownership works across agent tool-calling patterns, that post covers the tradeoffs in detail.
The gap this post opened never actually closes, since Scalekit's catalog will never have every internal tool a team wants, and neither will anyone else's.
What changes is that the gap stops being the end of the road. Grafana walked in with zero prior support, a create_custom_provider() call, and a connection; later, it has a connected account, an authorized user, and 118 real tools Hermes can call by name. "Not in the catalog" stops mattering the moment a custom connector exists for it.
Connecting Hermes Agent to Your Tools and APIs got one person talking to one tool safely. Multi-User Access Control for AI Agents on Hermes got a whole team talking to that tool without sharing a credential. This post removed the last restriction: the tool no longer has to be one Scalekit already supports. Build the connector, and Hermes can call it, whatever it is. For teams thinking about agent auth patterns and anti-patterns at scale, that post is the natural next read.
Only if it isn't already in Scalekit's catalog, 389 providers at the time of writing. Worth checking first; the same live check this post opened with.
Check whether the tool exposes its own MCP server, not its auth type. A plain REST API needs BEARER, API_KEY, or OAUTH, called through client.actions.request(). A tool with its own MCP server, Grafana Cloud being a real example, needs OAUTH against that MCP endpoint, called through list_tools() and execute_tool(). Both are documented, supported paths.
The same security guidance from Connecting Hermes Agent to Your Tools and APIs and Multi-User Access Control for AI Agents on Hermes applies: credentials live in Scalekit, never in Hermes's own config, and per-user identifiers keep each person's access scoped to their own authorization. For a broader look at secure token management for AI agents, that post covers storage, rotation, and expiry in depth.
No. client.actions.list_tools() discovers every tool the upstream MCP server publishes automatically, 118 of them for Grafana in this post, with no hand-written tool definitions anywhere in the connector setup.
Check the Scalekit dashboard, under AgentKit → Connectors. A new custom connector shows up there alongside the built-in ones. list_providers() in the Python SDK isn't a dependable way to check this today: a connector confirmed live and working through this post's Grafana example never showed up in a full, paginated list_providers() scan, even after real connections and tool calls against it succeeded. The dashboard is the source of truth here, not that call.