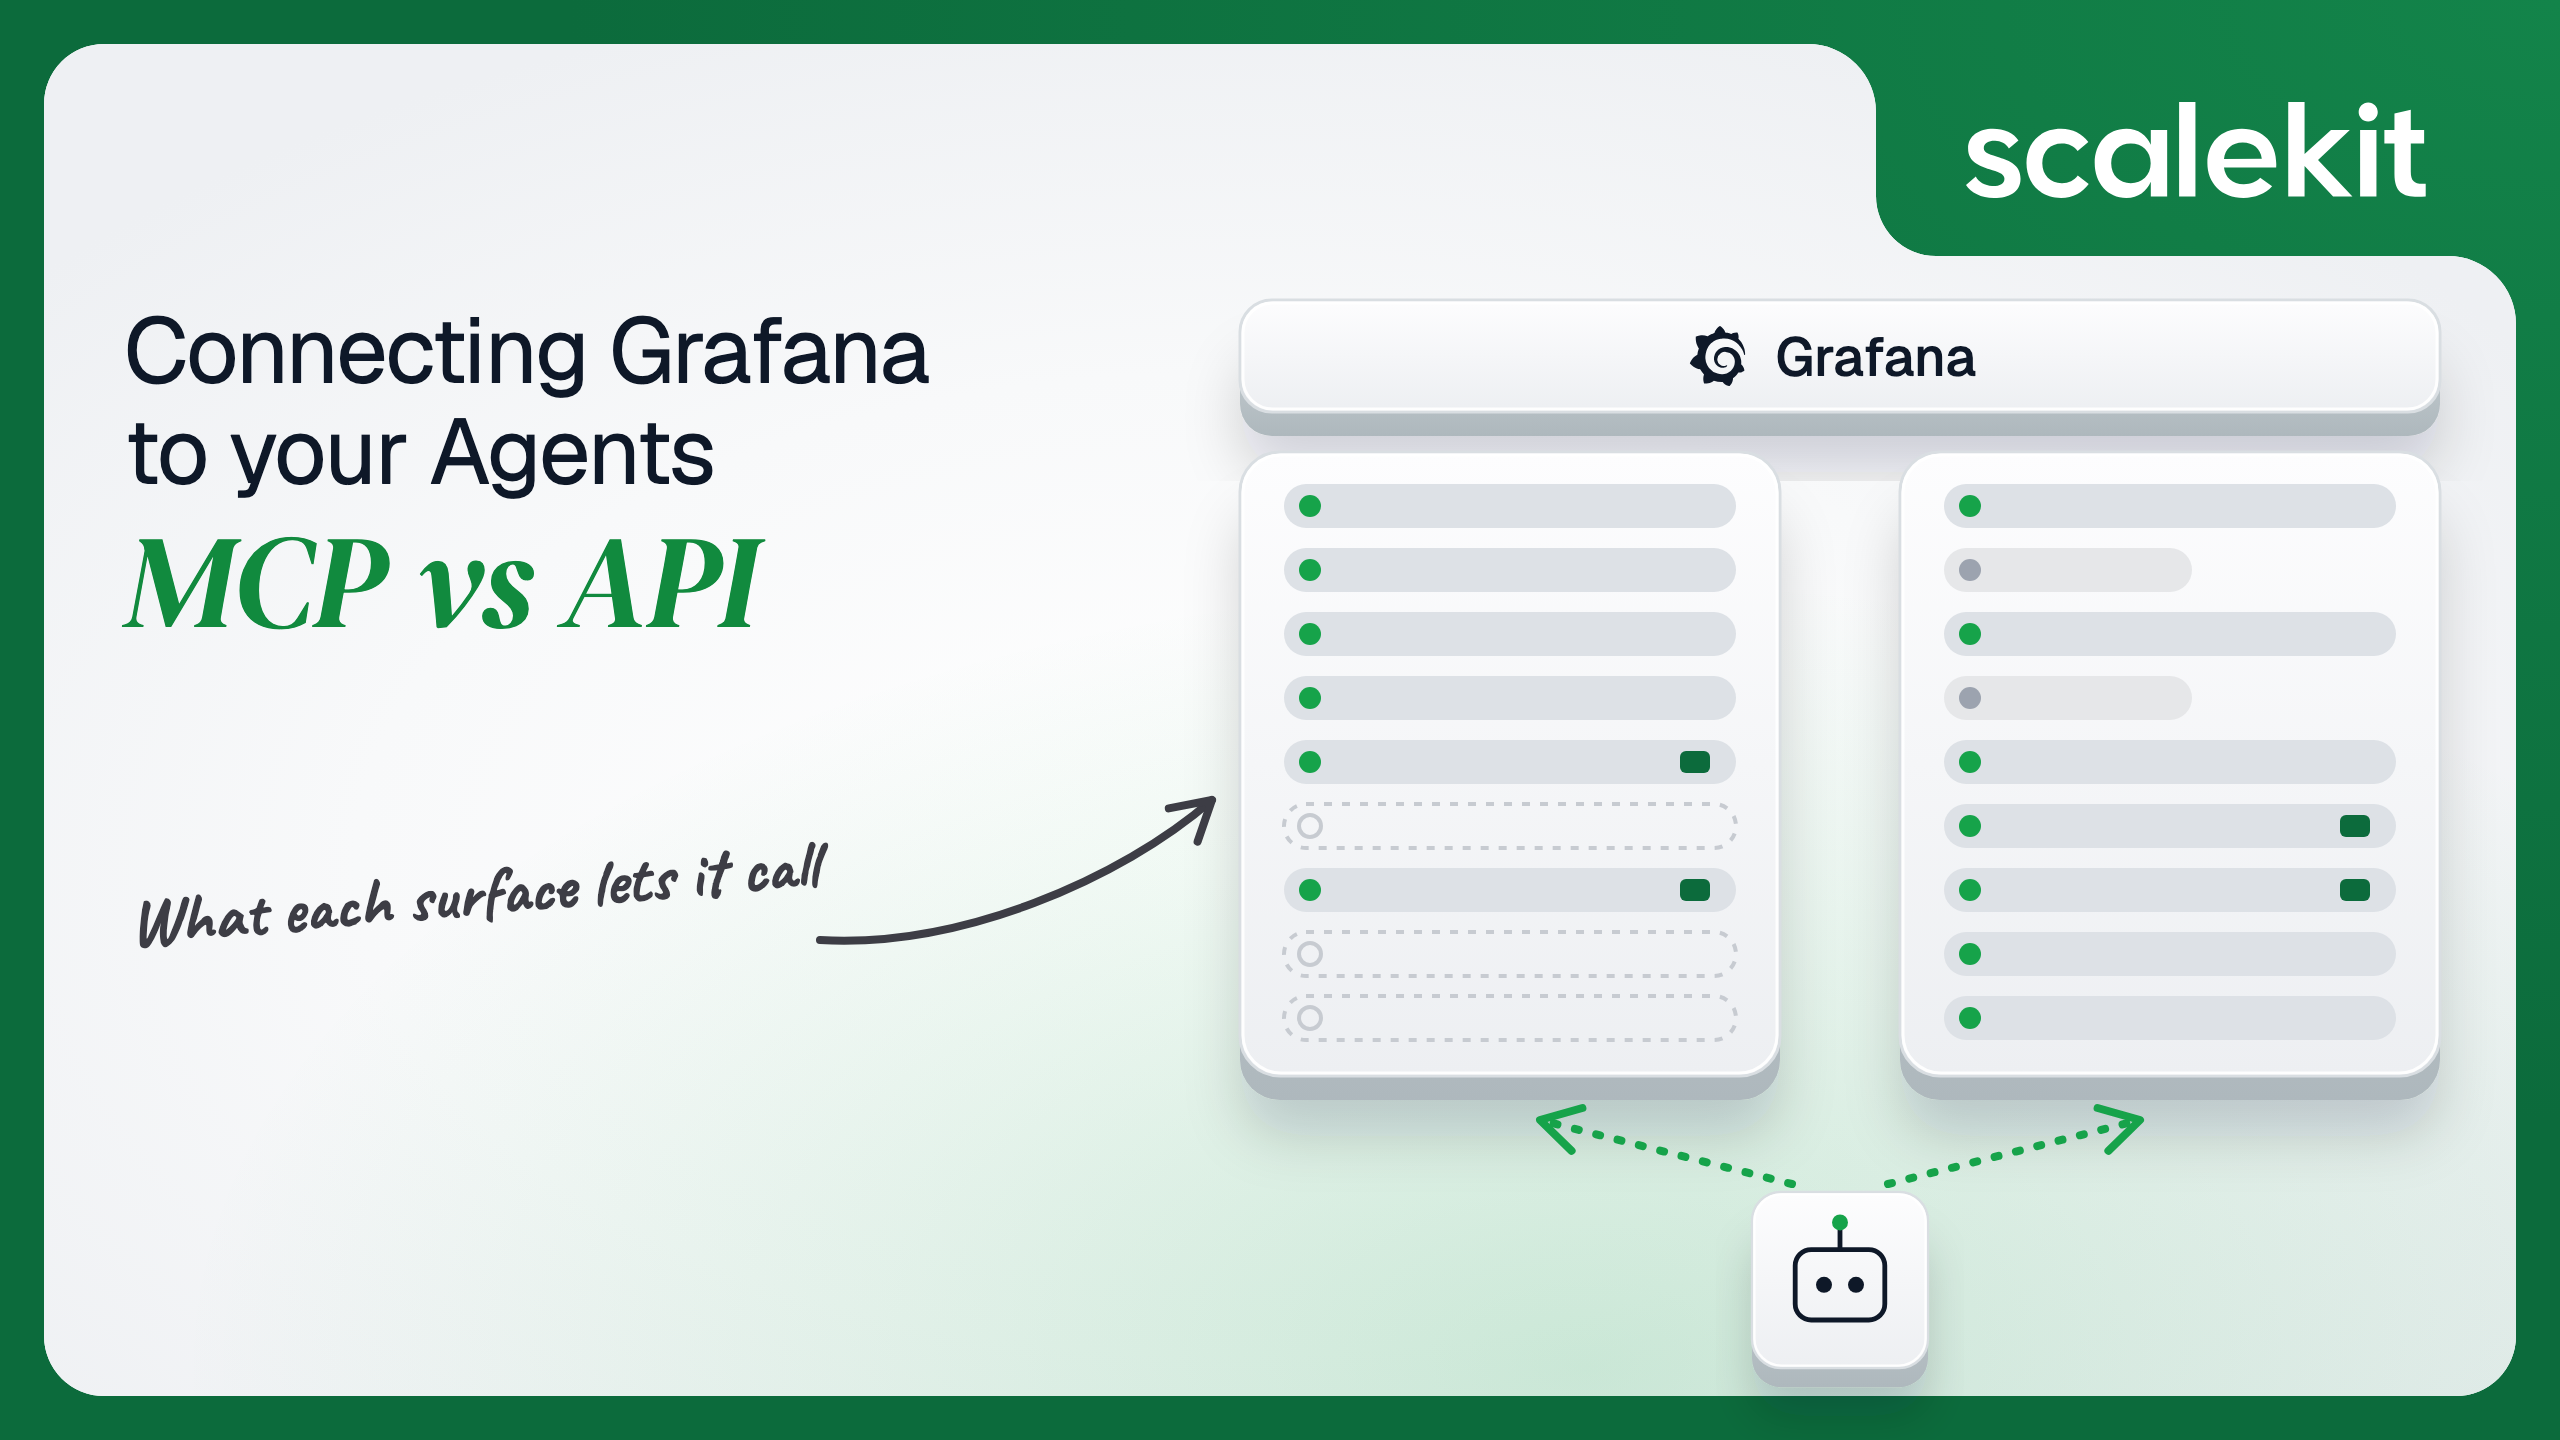


Grafana gives an agent three ways in: a hosted MCP server for Grafana Cloud, an open source MCP server you deploy yourself, and the HTTP API both servers wrap. They differ on which deployments they reach, whose identity the agent acts with, and how much query cost a model can generate before anyone notices. This guide compares what each path lets an agent do, the credential each one puts you on, and how to run an observability agent across many customer instances in production.
Your agent needs to work inside Grafana: tell an on-call engineer which alerts are firing, pull the p99 latency series behind a dashboard panel, drop a deployment annotation on the right graph, or mute a noisy alert during maintenance. Grafana gives you three ways in. A hosted MCP server for Grafana Cloud, an open source MCP server you deploy yourself, and the HTTP API both servers wrap. They differ on which Grafana deployments they reach, whose identity the agent acts with, and how much query cost a model can generate before anyone notices. Here's how to pick.
Grafana Cloud MCP server. Grafana describes it as "a remotely hosted Model Context Protocol (MCP) server that lets external AI agents connect directly to your Grafana Cloud data." The endpoint is https://mcp.grafana.com/mcp, with a per-stack form (https://mcp.grafana.com/mcp/<your-stack>.grafana.net) for users with several stacks. It is part of Grafana Assistant, supports Streamable HTTP only, and does not support self-hosted Grafana. Users authorize in the browser with OAuth 2.1; the token is valid for 1 hour and refreshes automatically for 30 days. Connecting requires the Assistant Cloud MCP User role or the grafana-assistant-app.cloud-mcp:access permission. Docs: Grafana Cloud MCP server.
Open source mcp-grafana. Maintained by Grafana Labs on GitHub, it runs locally over stdio (the default) or as a network service over SSE or streamable-http, and works against self-hosted Grafana 9.0 or later and Grafana Cloud. It authenticates to Grafana with GRAFANA_SERVICE_ACCOUNT_TOKEN (or GRAFANA_SERVICE_ACCOUNT_TOKEN_FILE), with GRAFANA_USERNAME and GRAFANA_PASSWORD, or with the deprecated GRAFANA_API_KEY. Neither page carries a beta or GA label. Docs: grafana/mcp-grafana and Open source Grafana MCP server.
The Grafana HTTP API covers dashboards, folders, data sources, data source queries (POST /api/ds/query), alerting, annotations, teams, users, and organizations. Newer resources sit under Kubernetes-style paths: dashboards are served at /apis/dashboard.grafana.app/v1/namespaces/:namespace/dashboards in Grafana 12 and later, paginated with a metadata.continue token.
Authentication is simpler than most SaaS APIs and less per-user. On self-managed Grafana, you can use basic auth or a service account token. On Grafana Cloud, only a service account token works. Both go in Authorization: Bearer <token>, with an optional X-Grafana-Org-Id header to pick the organization. Docs: HTTP API authentication, Dashboard API, Data source API.
The pattern: both MCP servers are built around investigation. They ship language-specific query tools for PromQL, LogQL, and TraceQL, plus Incident and OnCall. The HTTP API is the control plane: every resource Grafana manages, one generic query endpoint, and no opinion about which data source you are talking to.
Grafana dashboards are large JSON documents. Pulling one into context to answer "which data source does the checkout latency panel use?" can cost thousands of tokens. The MCP servers solve that with get_dashboard_summary and get_dashboard_property, which takes a JSONPath such as $.panels[*].title. The open source README tells you to avoid get_dashboard_by_uid unless you need the complete JSON.
Queries get the same treatment. POST /api/ds/query accepts any backend data source, which means the caller must know each data source's query model: expr for Prometheus and Loki, rawSql for SQL sources, and so on. The MCP servers split that into list_prometheus_metric_names, list_loki_label_values, and typed query tools, so the model discovers labels before it writes PromQL. Writing the schema is the hard part. Not the API call.
The open source server also ships grafana_api_request, which calls any Grafana HTTP API endpoint. That closes the capability gap and opens a scope gap: one tool now reaches every endpoint the token can reach.
The hosted server triggers a browser consent flow, and Grafana is explicit about the result: "The agent has only the permissions your Grafana RBAC grants you." The consent page offers three access levels. Read covers dashboards, alerts, incidents, metrics, logs, and traces. Query covers raw SQL, which Grafana warns can "execute as written and can modify data." Write covers creating and modifying dashboards, alerts, incidents, and Assistant investigations, and requires the grafana:write scope. For a read-only agent, the user must clear both Write and Query; clearing only Write still allows raw SQL.
What the user can't do, the agent can't do. Two constraints come with it. The OAuth token refreshes for 30 days, then the user re-authorizes, so a scheduled agent that nobody opens for a month stops working. And each MCP-connected user counts as an active user for Grafana Cloud billing.
Run locally over stdio, the open source server reads one credential from its environment and uses it for every tool call. The README's quick setup suggests assigning the built-in Editor role to the service account, and states the tradeoff plainly: it is "less restrictive" and suited to cases where "convenience outweighs strict least-privilege requirements." That works for one developer. It is a single-user solution.
Run as a shared service over streamable-http, the server can take per-request credentials. With GRAFANA_ALLOW_URL_OVERRIDE enabled, each request can carry X-Grafana-URL and X-Grafana-Service-Account-Token, and GRAFANA_FORWARD_HEADERS can pass a session cookie through from an SSO proxy. The README is direct about the risk: URL overrides "let MCP callers select outbound HTTP(S) destinations," and it tells you to deploy behind an authenticating proxy that supplies the matching token. Over SSE, per-request headers never reach tool calls. Caller authentication to the server itself (MCP_GRAFANA_SERVER_TOKEN) is optional, and binding a non-loopback address without it only logs an error today.
A service account is a non-human identity with a role, such as Viewer, Editor, or Admin, plus any fine-grained RBAC permissions you grant. One account can hold several tokens, and each token can carry an expiration. Grafana fully deprecated API keys on February 10, 2025, and Grafana v11.6 migrated existing keys to service accounts; existing integrations kept working (announcement).
The identity problem follows from the design. A service account token says "this integration," not "this engineer." The mcp-grafana README notes that a service account token "remains bound to its single organization," so a customer with three Grafana organizations needs three tokens. And a Grafana Cloud instance and a self-hosted one never share a token.
In a multi-tenant B2B agent, MCP's OAuth flow gives you a token per user. Direct API calls give you a credential per user. In neither case does the path itself solve storage, rotation, or revocation; those are infrastructure problems regardless of which path you choose.
Grafana adds a routing problem. Every credential is meaningful only next to its instance URL and organization, and on Kubernetes-style endpoints, its namespace: default for the default organization, org-<id> for another one, or stacks-<id> on Grafana Cloud. Your credential store has to bind each token to the user, the instance, and the organization it was issued for.
Recommended reading: OAuth vs API keys for AI agents
With the hosted server, Grafana owns the tool schemas, the hosting, and OAuth. You own the 30-day re-authorization gap, the decision about which access levels each user grants, and the fact that it only reaches Grafana Cloud. If your customers run self-hosted Grafana, the hosted server is not an option for them.
With the open source server, you own the deployment. That means choosing transports, setting --disable-write or --disable-query, patching releases, and configuring the 40 tool categories that are off by default. The README spells out an important subtlety: --disable-write also removes query_sql and query_influxdb, because raw SQL "will run a DROP TABLE" if the data source credentials permit it.
You own everything: schemas, pagination, retries, and the token lifecycle. Pagination differs by endpoint family. The Kubernetes-style dashboard and folder endpoints use a metadata.continue token. The legacy search endpoint uses page and limit. Alert rule status uses group_next_token.
The expensive part of a Grafana call is rarely the HTTP request. It is the query your data source runs. POST /api/ds/query accepts relative time ranges like now-30d, and the open source MCP README warns that Loki does not enforce max_query_bytes_read on log queries without a line filter, "so a broad selector over a wide range can scan terabytes." The open source server ships a Loki guardrail (--loki-guardrail-mode, off by default) that, when set to enforce, rejects broad selectors and caps the effective time range at 24 hours. On the direct API path, there is no guardrail unless you write one.
Grafana is adding versioned /apis/<group>/<version>/ endpoints alongside the legacy /api/ ones. The dashboard API lists v1 in its endpoint table and points to dashboard.grafana.app/v2 in Swagger, and v1beta1 is served by Grafana 12 and later. An agent that talks to a fleet of customer instances on Grafana 10, 11, and 12 will meet different endpoints for the same dashboard.
The MCP servers absorb some of this for you. They also change on their own schedule: the open source server's default-off categories and flags are set per release, and the hosted server's tool list is defined by Grafana, not by you. Pin the tool names your agent depends on and alert when one disappears.
Both paths hand you a credential per user. Neither hands you a vault. Take 40 customers with 5 engineers each who connect Grafana to your agent. On the hosted MCP path, that is 200 OAuth grants, each expiring if unused for 30 days, and none reaching the customers on self-hosted Grafana. On the API path, that is up to 200 service account tokens across self-hosted and Cloud instances, each tied to one instance and one organization, some with expirations and some without. Every one must be encrypted at rest, kept out of logs and LLM context, and revoked when an engineer leaves or a customer churns.
The tempting shortcut is one Editor service account per customer, shared by every engineer who uses the agent. That collapses 200 credentials into 40 and turns each of them into a key that can rewrite any dashboard and mute any alert in that customer's Grafana. Fewer secrets, larger blast radius per secret.
Scalekit's Grafana connector stores each user's Grafana access token in the token vault and sends it with every call, so the MCP vs API decision doesn't change your auth infrastructure. Your agent passes an identifier; the token never enters the agent runtime or the LLM context.
Recommended reading: why a token vault matters for AI agent workflows
Scalekit's grafana connector is an API-path connector with 36 tools: 28 read, 8 write, and 0 destructive. It uses Bearer Token authentication: each user connects their own Grafana access token once through a Scalekit-hosted page, and Scalekit stores it as that user's connected account credential. Ask users to create a service account token with the narrowest role their job needs. A Viewer token is enough for an agent that only reads alerts and dashboards.
Create a Grafana connection in AgentKit > Connections in the Scalekit dashboard. The name you give it is the connection_name your code passes, and the string must match the dashboard exactly. This is the most common integration error. Copy SCALEKIT_ENVIRONMENT_URL, SCALEKIT_CLIENT_ID, and SCALEKIT_CLIENT_SECRET from Developers > API Credentials into .env.
get_or_create_connected_account returns the user's connected account. If it is not ACTIVE, get_authorization_link returns a link to the page where the user enters their Grafana credentials. The agent never sees the token.
This is not a catalog load. The agent asks for the tools this user's connected account is authorized to call, and narrows them to the six an alert triage agent needs. All six are read-only. grafana_silence_create and grafana_dashboard_update never reach the model, so it cannot mute an alert or rewrite a dashboard while answering a question.
The loop runs until the model stops requesting tools. Every tool call executes with this user's Grafana credential, so the agent sees only the alert rules and dashboards that user can see.
For pipelines, skip the model. execute_tool runs one tool with a fixed input and returns data plus an execution_id you can log. This check pulls every firing critical alert that is not silenced or inhibited.
A deploy pipeline writes a region annotation for the release window. Leaving dashboard_uid out makes it an organization-wide annotation, which any dashboard can display by filtering on its tags.
Data source queries need a UID and type from grafana_datasource_list. grafana_datasource_query wraps POST /api/ds/query, takes from, to, and a queries array, and returns frames keyed by refId. Scalekit lists it as a write tool, so include it only in agent roles that should run arbitrary queries.
Dashboard and folder tools call the Kubernetes-style endpoints and take a namespace: default for the default organization on self-managed Grafana, org-<id> for another organization, or stacks-<id> on Grafana Cloud. Store it per connected account alongside the tenant's config.
The connector does not cover alert rule writes, Grafana Incident, or OnCall. If your agent needs them, register a custom connector for those endpoints and make proxied calls through actions.request(), keeping the same connected account and vault model.
The open source mcp-grafana server registers 79 tools with its default categories. At roughly 200 tokens per tool definition, that is about 15,800 tokens of context before the agent does any work, and the model is choosing from a decision space that includes alerting_rules_write and grafana_api_request. Even Scalekit's 36 Grafana tools cost about 7,200 tokens if you load all of them. The fix is not better prompting. It is surface reduction. A Scalekit virtual MCP server declares exactly which tools an agent role can see, and session tokens keep each run bound to one user's connected accounts. Docs: set up a virtual MCP server.
One server definition serves every user. Before each run, check that the user's accounts are active and mint a short-lived session token scoped to them. Any MCP client that speaks streamable HTTP can connect; this example uses langchain-mcp-adapters (pip install langchain-mcp-adapters) and passes the token as a Bearer header.
The agent sees four tools, none of which can change Grafana. The endpoint is static; the identity is per-user.
Every execute_tool call returns an execution_id, and every execution is attributed to a connected account, which maps to one of your users and one customer's Grafana instance. When a customer asks which agent run created a silence at 2am or edited the checkout dashboard, the answer is a lookup, not an investigation. grafana_silence_create takes a required created_by field; set it from your user record so Grafana's own silence list names the person, not the integration.
A shared token breaks this. If every engineer at a customer runs on one Editor service account, Grafana attributes every dashboard version, annotation, and silence to that service account, and your side can only prove that the shared credential did it. grafana_current_user_get is the quickest way to see which identity a connection actually uses. Shared credentials are a single-user solution. They do not survive a second user.
Recommended reading: audit trails for agent auth
If your agent is an interactive investigator for engineers on Grafana Cloud, use the hosted Grafana Cloud MCP server. It ships PromQL, LogQL, and TraceQL tools, respects each user's RBAC through OAuth, and needs nothing deployed. If your customers run self-hosted Grafana, or your agent runs headless on a schedule, build against the HTTP API, and use the open source mcp-grafana server only where one team's service account is the whole security model. Many production agents will do both: MCP for the question at 2am, the API for the annotation the deploy pipeline writes every release. Either way, the credential problem is the same, and that's what needs production-grade infrastructure.
Two. The hosted Grafana Cloud MCP server uses OAuth 2.1, acts with the signed-in user's RBAC, lists 62 tools plus proxied Tempo tools, and does not support self-hosted Grafana. The open source server from Grafana Labs runs wherever you run it, reaches self-hosted and Cloud instances, documents 119 tools with 40 off by default, and authenticates with a service account token, basic auth, or per-request headers you supply.
With a service account token sent as a Bearer header on every deployment, and basic auth on self-managed Grafana only. API keys were fully deprecated in February 2025 and migrated to service accounts in Grafana 11.6. A service account token is bound to one instance and one organization, carries a role such as Viewer, Editor or Admin, and says which integration is calling, not which engineer.
Search dashboards and folders, read a dashboard summary or a single property without the full JSON, create and update dashboards, query Prometheus and Loki, use proxied Tempo and Pyroscope tools, manage alert rules, create annotations, and work with Grafana Incident and OnCall. The consent page groups access into Read, Query and Write levels, and the raw SQL under Query can modify data if the data source credentials permit.
Because the cost is in the data source, not the HTTP call. A broad Loki selector over a wide time range with no line filter can scan terabytes, since Loki does not enforce its byte limit on such queries. The open source MCP server ships an optional guardrail that rejects broad selectors and caps the range at 24 hours; on the direct API there is no guardrail unless you write one.
When it runs headless, such as a deploy pipeline writing an annotation on every release or a nightly job listing rules in error health across customer instances; when customers run self-hosted Grafana, which the hosted server does not support; when the workflow is narrow and deterministic, such as creating a silence for a maintenance window; or when it needs endpoints the MCP servers leave out or turn off by default, such as teams and organization users.
The Grafana connector exposes 36 tools over the Grafana HTTP API with no destructive tools. Each user connects their own Grafana access token once, Scalekit stores it in the token vault and sends it with every call, a virtual MCP server narrows an alert triage agent to read-only tools so it cannot mute an alert or rewrite a dashboard, and every execution is attributed to that user and instance.
Browse the Scalekit Grafana connector and the Grafana connector docs with the full tool list. See Scalekit pricing, or talk to us.