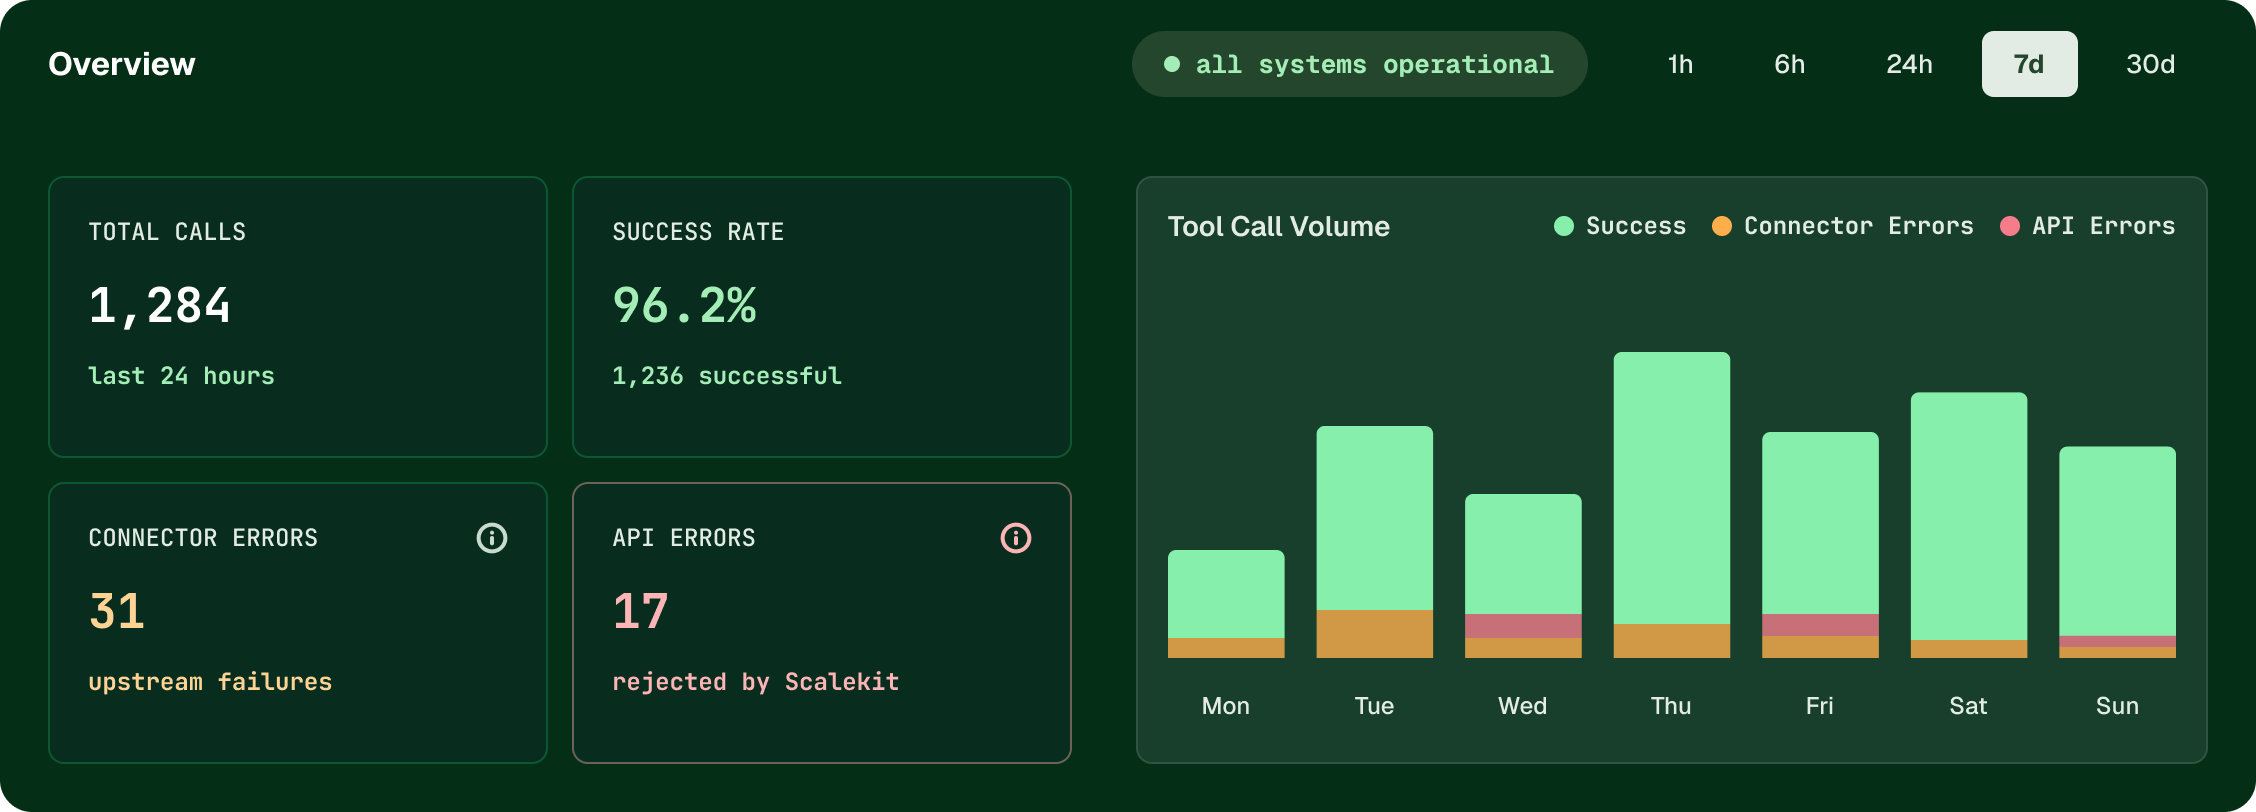
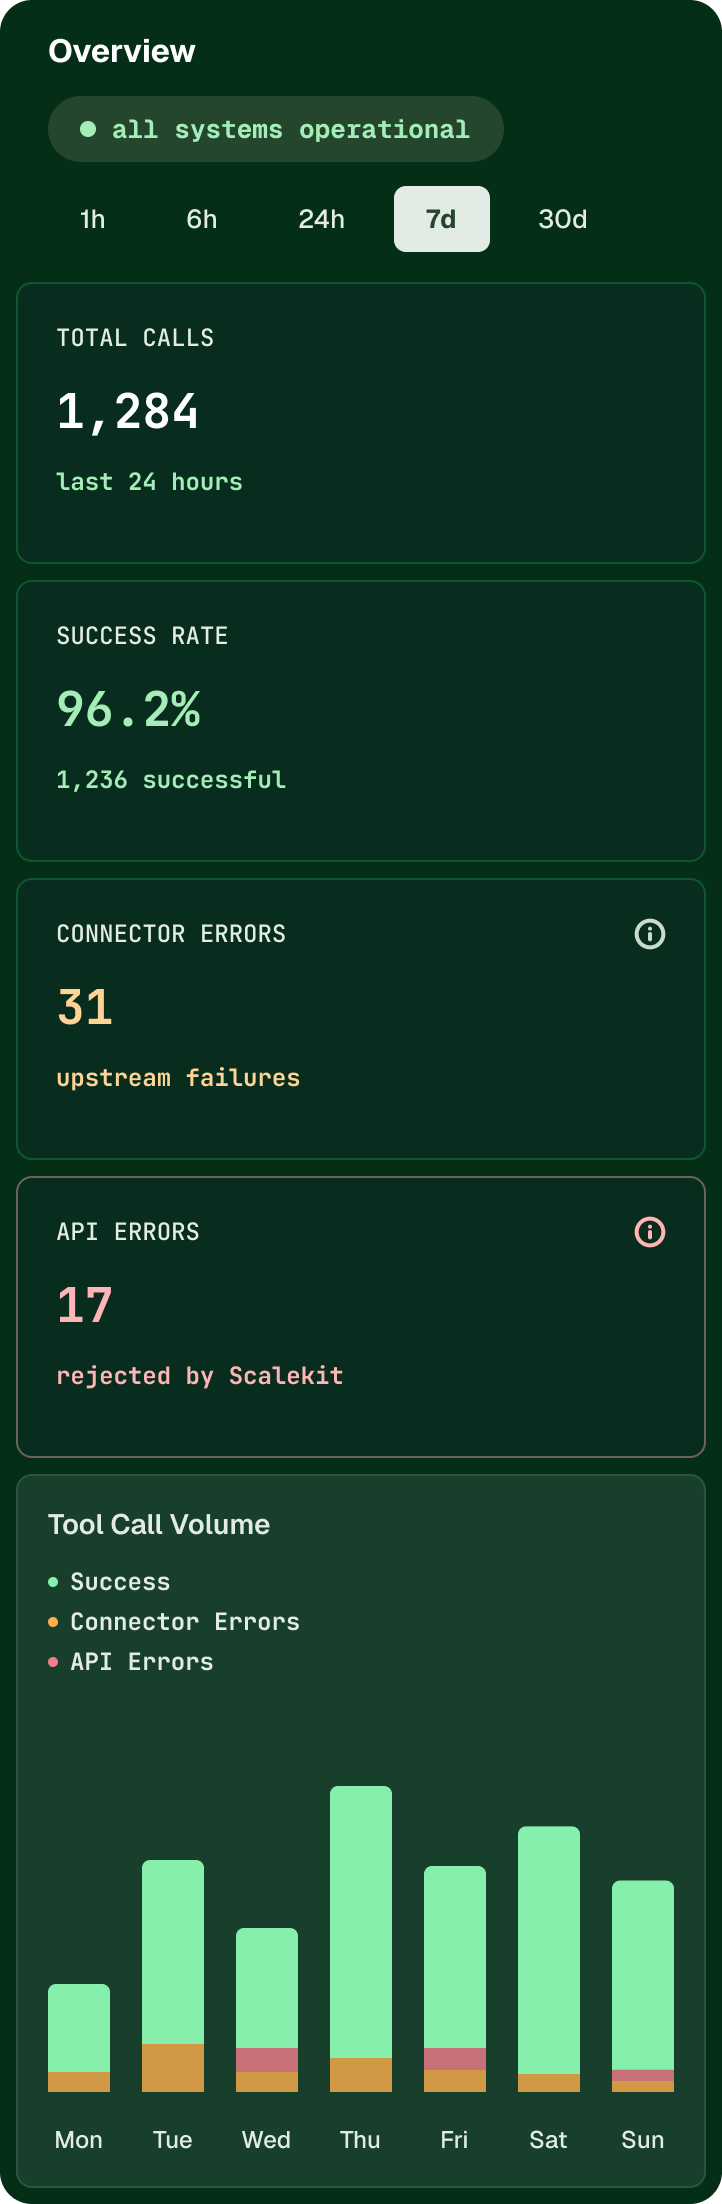
Success rate, errors and volume for every connector, or just one. See the week's shape before you hunt for a single call.
Per connector, not just overall
A 96% aggregate can hide one connector failing half its calls. Scope the view and it surfaces.
On from the first call
Nothing to instrument, no SDK to add, no sampling rate to tune.
Volume is a signal too
An agent that suddenly makes ten times the calls is usually looping, not working harder.
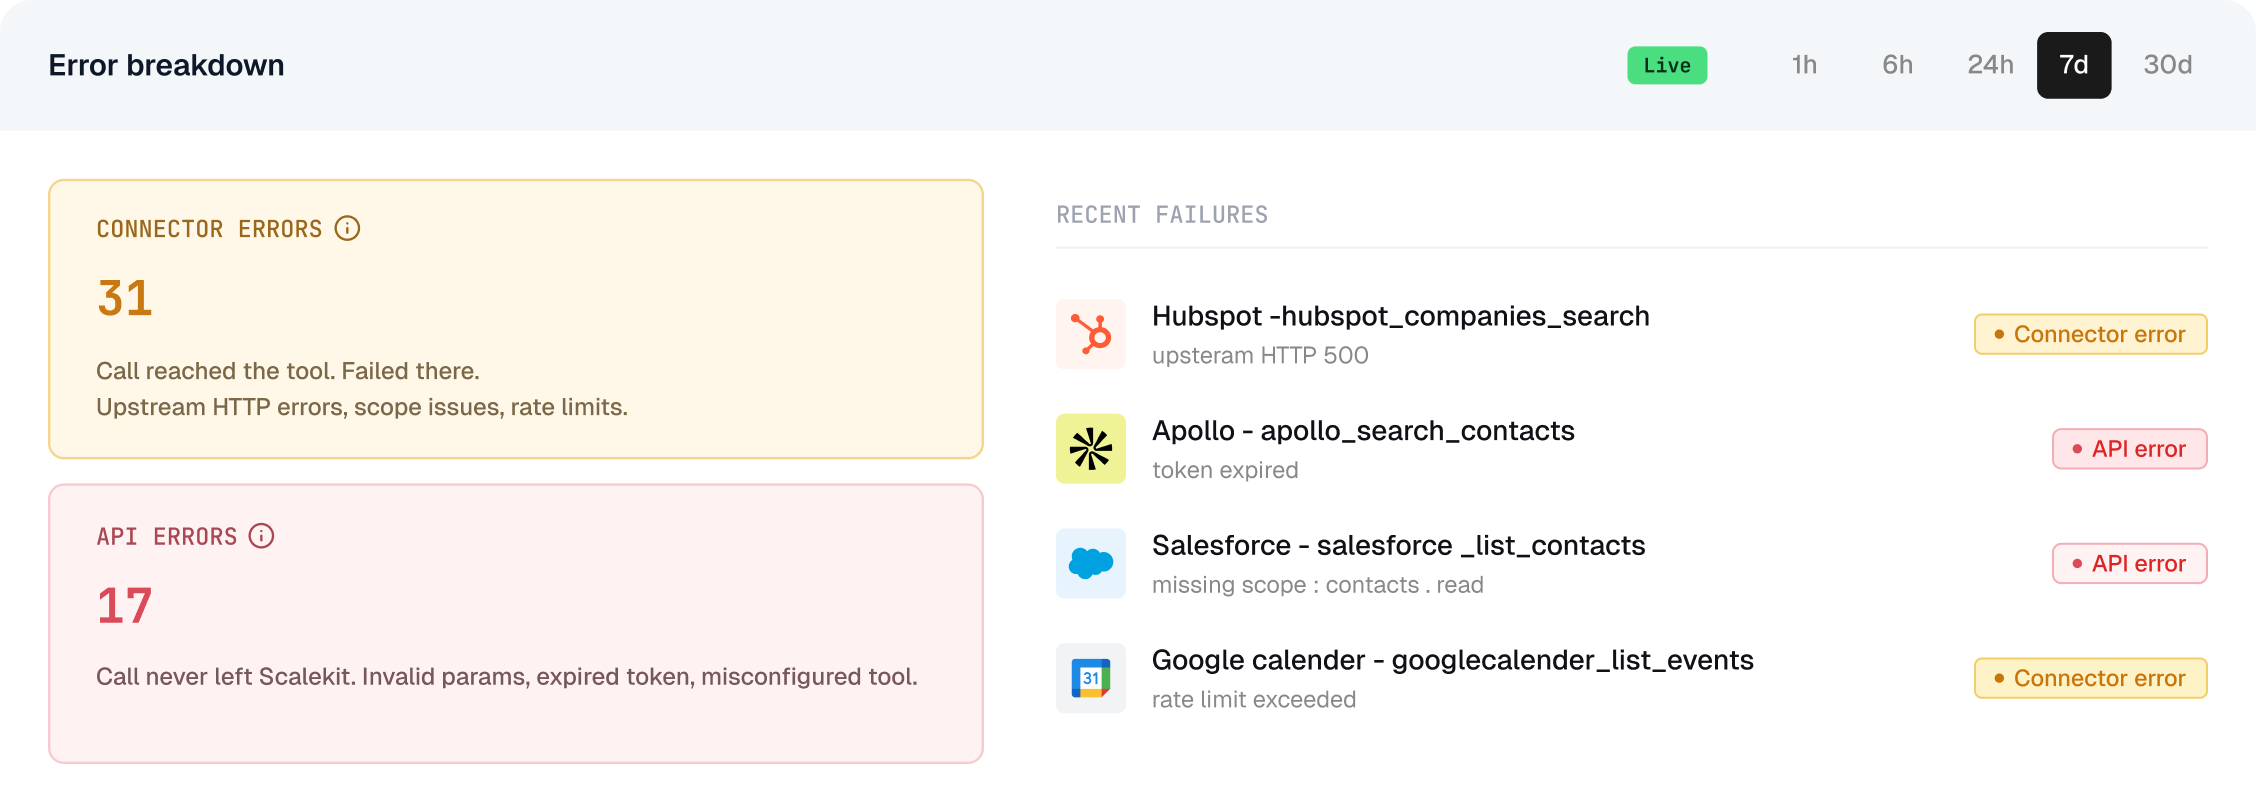
Did your agent fail, or did the connector?
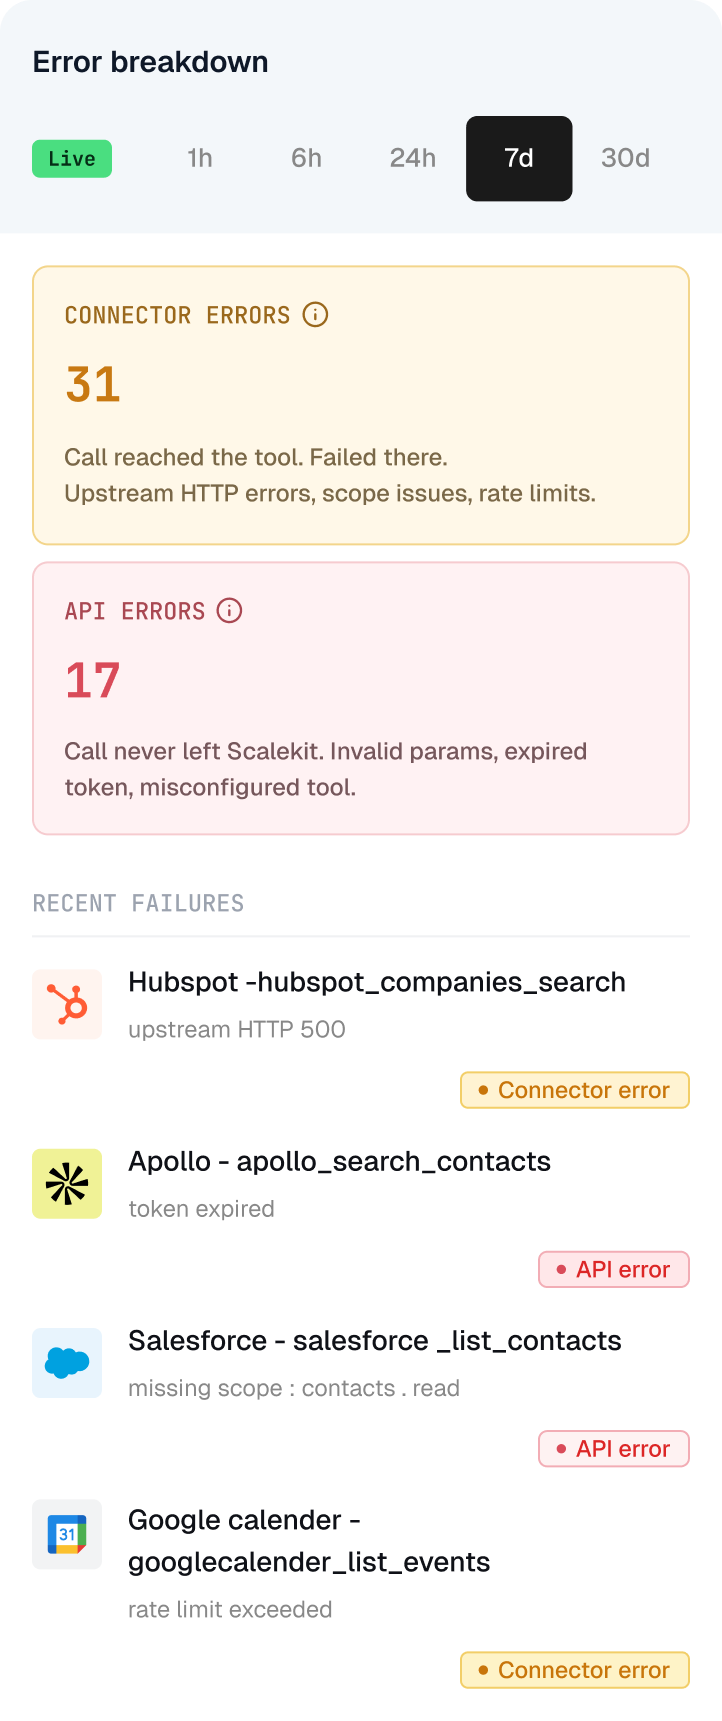
Every failure is marked as a connector error or an API error, so you know whether to fix your setup or wait on the app.
Connector error means wait, or back off
The upstream is throttling, down, or refusing the scope. Retrying may work; changing your code usually won't
API error means look at your own setup
A tool schema that needs tightening, a grant that lapsed, a config pointing somewhere it shouldn't. These are yours to fix.
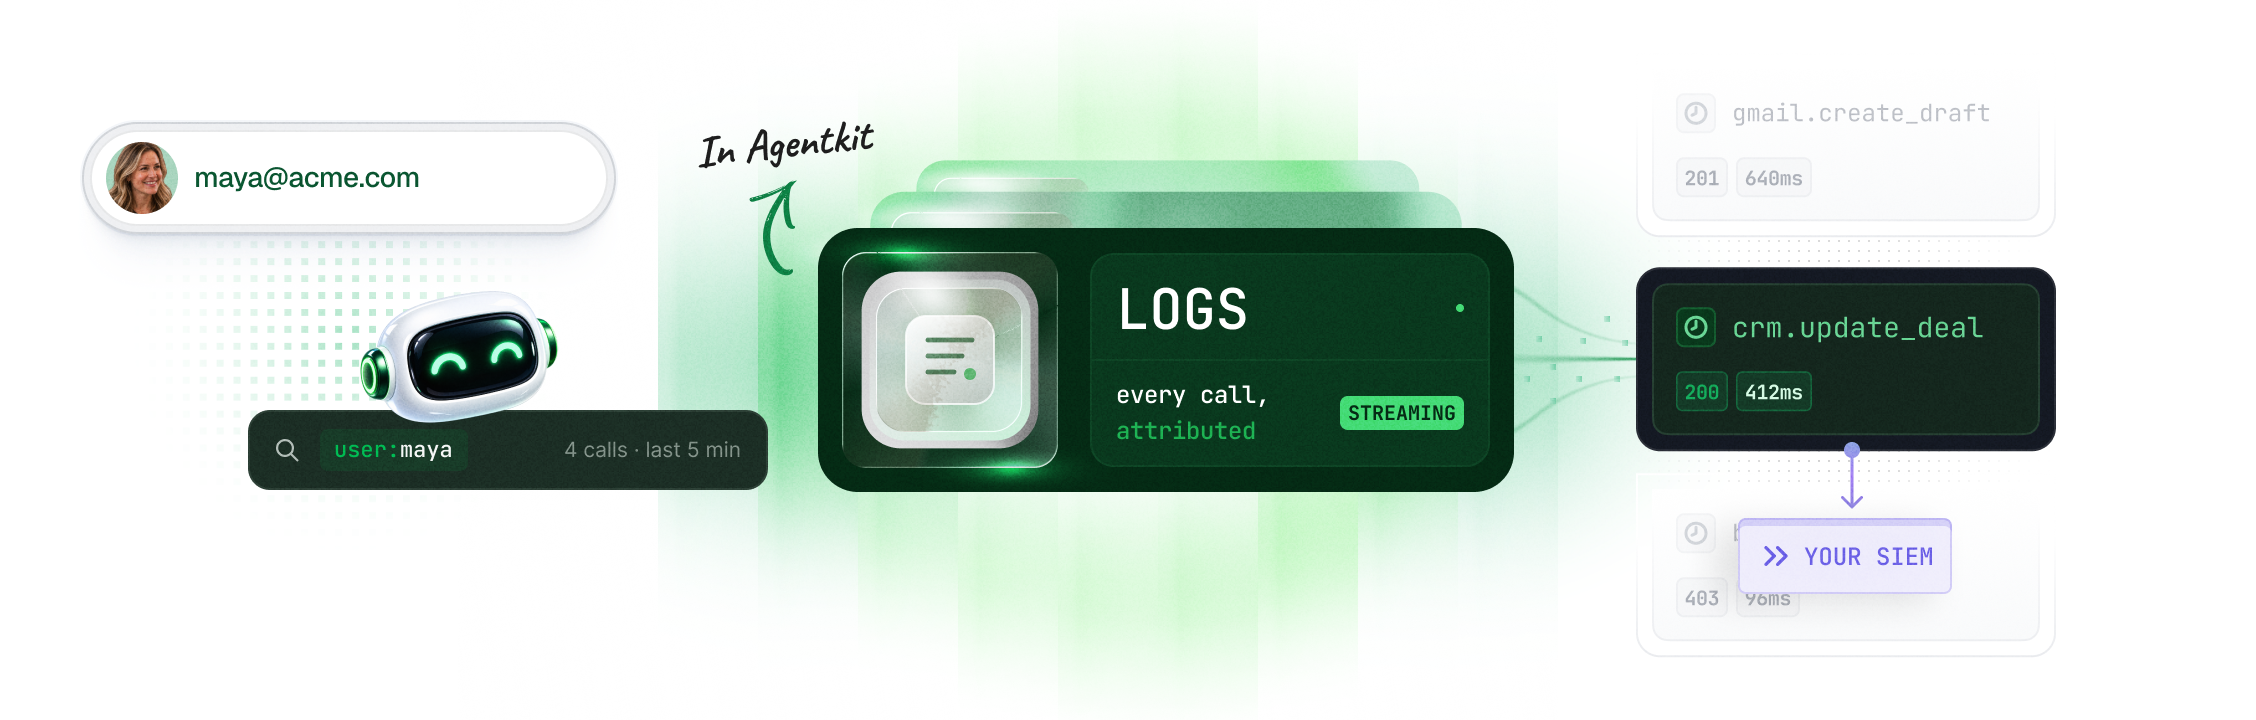
Every call, down to the payload.
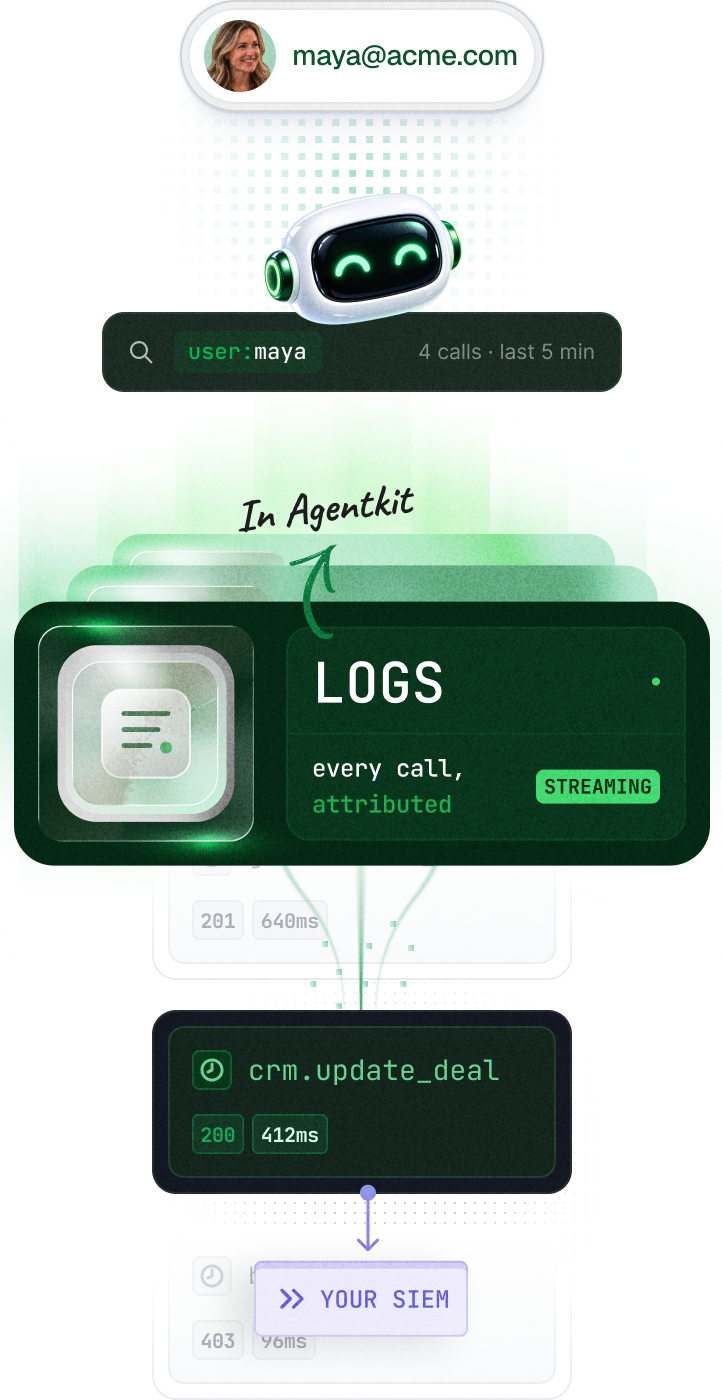
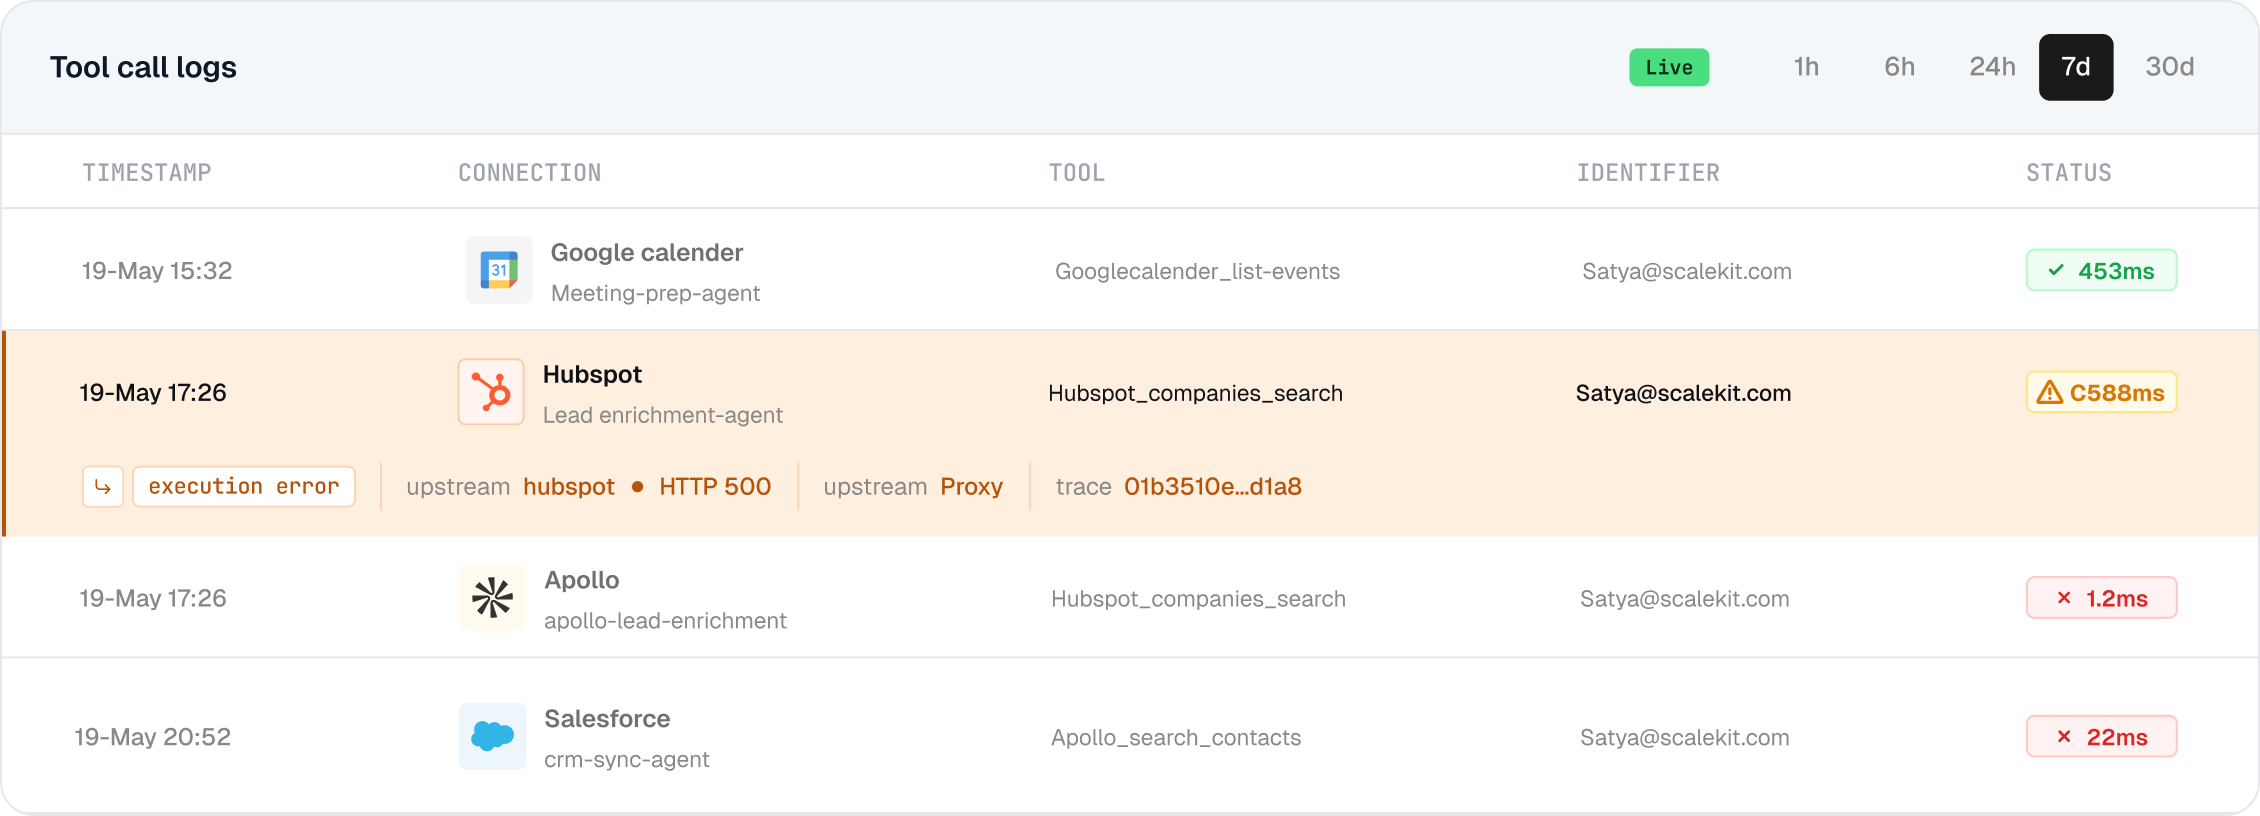
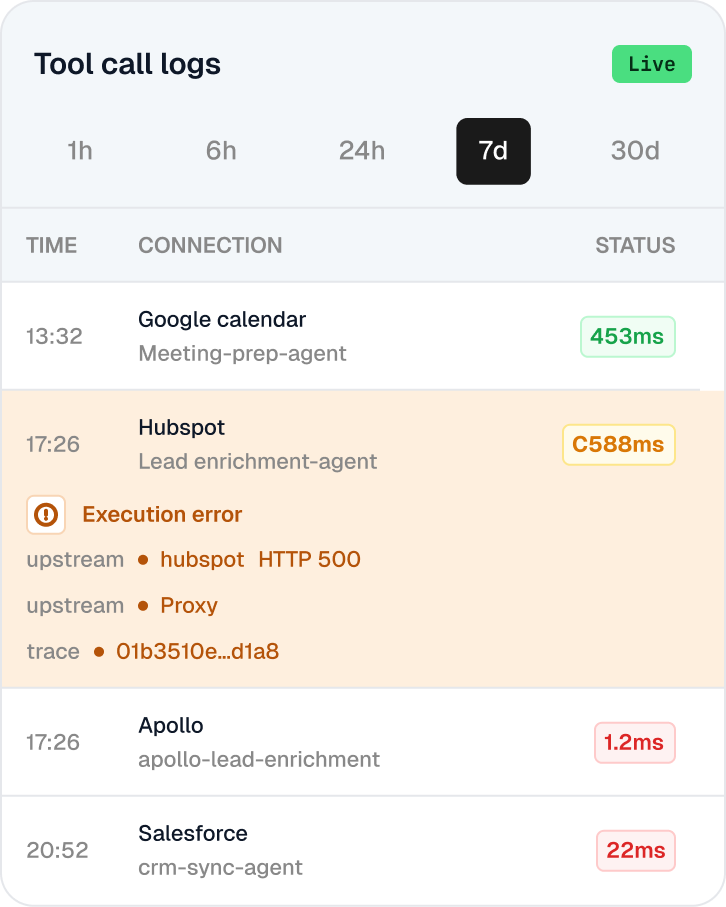
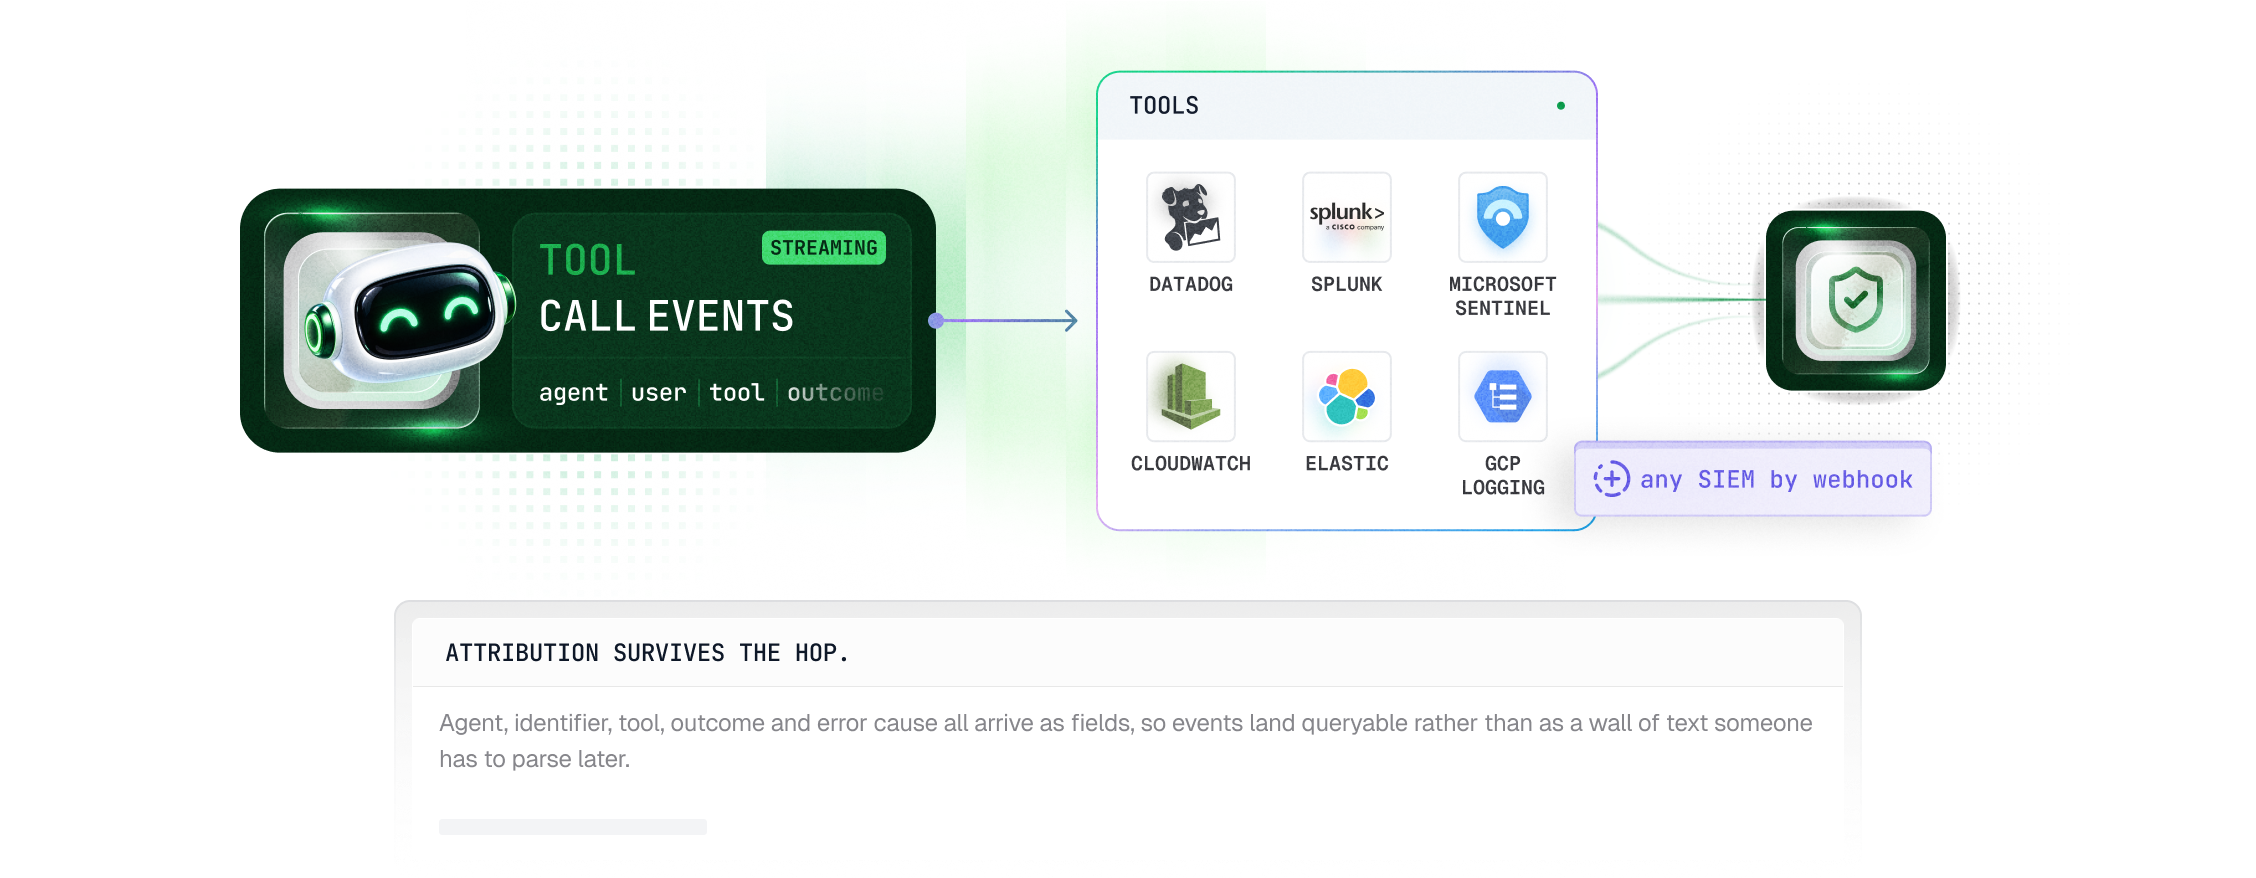
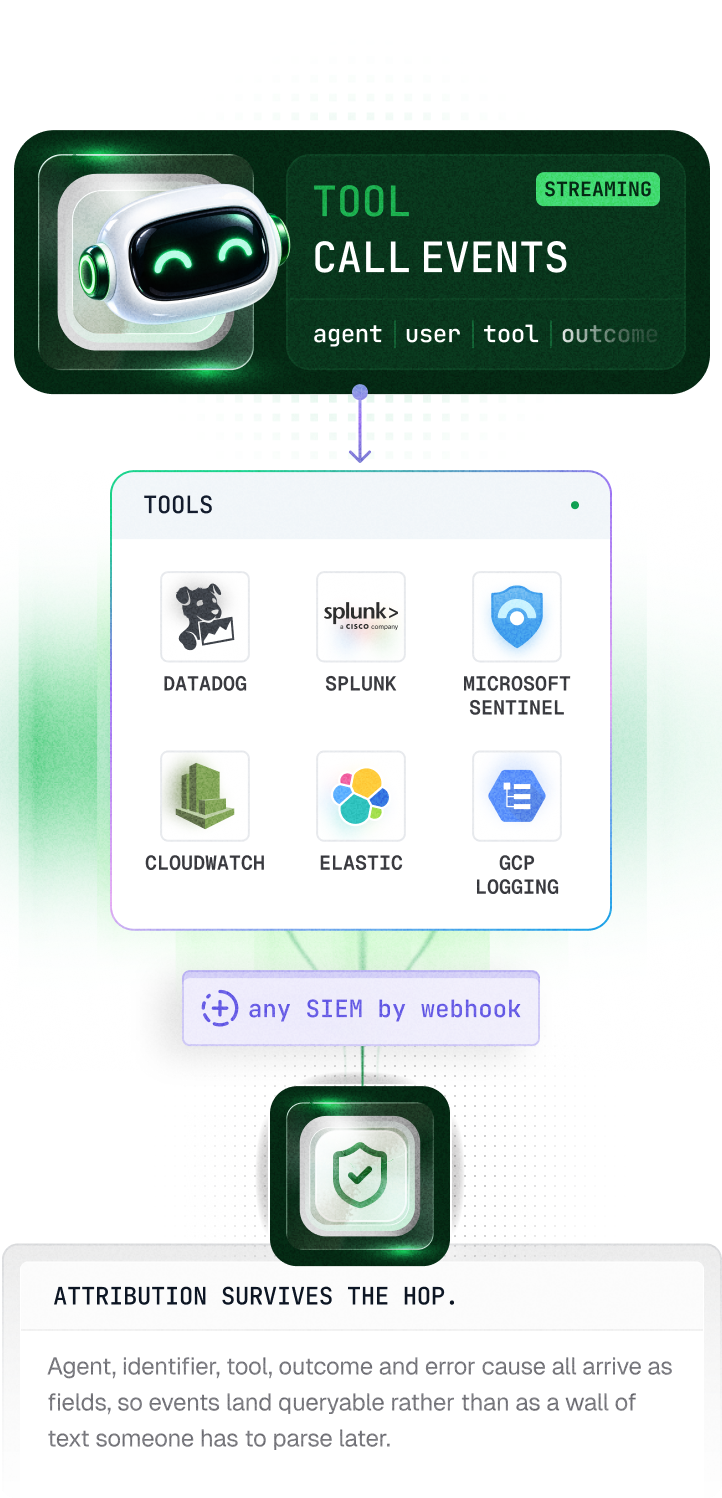
Each tool call is captured as a structured event — when it ran, which agent ran it, which tool it hit, whose account it touched, how long it took and what came back.
Agent-level attribution
Three agents sharing one connector are three separate rows. You can tell which one is misbehaving.
The identifier is a real person
Filter to one customer and you have the answer to "what did your agent do in my account".
Reads as well as writes
A security review asks what an agent looked at, not only what it changed. Both are recorded.
An agent that waits to be asked is a chatbot.
Events stream as they happen, so security watches agent activity next to everything else.