

An agent automates ticket routing: pulling open items from Jira, reading account context from Salesforce, posting assignments to Slack. In staging it runs clean. No exceptions, consistent output. You ship.
Three weeks in, escalations go unrouted. Engineering opens the logs. No exception anywhere in the call chain. The agent ran, returned a success response at each step, and moved on. The Salesforce query had been executing against a delegated OAuth token that was revoked four days prior when a user disconnected the app from their Google account settings. The connector returned an empty result set without surfacing the auth failure. The agent treated empty context as valid state. Routing decisions ran without account data. Not a crash. Not a traceable error. A quiet degradation that looked like correct execution from every observability surface the team had instrumented.
This is not a staging versus production gap in any conventional sense. It is a structural property of how tool-calling agents traverse delegation chains.
As per Datadog, 1 in 20 AI model requests already fail in production, yet systems continue to run and return outputs that appear correct, making these failures difficult to detect. This captures only errors that surface as error codes. Silent failures: degraded outputs, stale state, partial executions, swallowed auth failures, do not appear in it at all.
The compound math makes this worse at scale. At 99% per-step reliability across a 10-step workflow, overall reliability is 90.4%. At 95% per step across 20 steps, it falls to 35.8%. Individual tool calls fail 3 to 15% of the time in well-engineered production systems due to network timeouts, rate limits, and upstream service interruptions. In development, tool calls succeed reliably. In production, those rates compound across multi-step workflows.
The correct diagnostic frame is not "my agent failed." It is: which layer in my agent's delegation chain degraded, and did it surface a signal I can act on? The answer to the second question is almost always: not yet.
A tool-calling agent does not execute a single operation. It traverses a delegation chain: LLM planner → orchestration layer → tool executor → connector → OAuth provider → upstream API. Each hop is an independent failure surface. The orchestrator observes only the tool executor's response; it has no direct visibility into what the connector, the OAuth provider, or the upstream API actually did.
This is why the same HTTP 401 can mean three structurally different things, and why the same HTTP 200 can represent either success or a committed write that never happened.
Each layer has a different signal profile, a different recovery path, and a different architectural fix. The identity layer gets the most depth below because it is where the majority of production failures originate and where signals are most consistently misread.
When a Salesforce tool call returns a 401, three distinct states could be true:
expires_in field from RFC 6749 tells you exactly when). The refresh token is still valid. Refresh it, retry once. If the retry fails, surface the error and stop.invalid_grant (RFC 6749), not a distinct "revoked" code. A retry with the same refresh token fails. An attempt to issue a new refresh also fails. Every retry attempt generates a new failed call.When thread A discovers a 401 and starts a refresh, threads B through N have already begun the same attempt, each unaware the others are doing the same. Thread A succeeds and issues a new token. Every other thread's refresh call invalidates that token by issuing yet another one. The thread that "wins" holds a valid token; every other thread is now holding an invalidated credential. This is the exact failure mode Box documents for its single-use refresh tokens: "If two concurrent requests both attempt a refresh, one will succeed and one will invalidate a now-stale token."
This is not a code bug. It is a structural consequence of reactive refresh (refreshing on 401 instead of proactively scheduling refresh before expiry). The fix is a refresh scheduler driven by the expires_in value from RFC 6749, with distributed locking to ensure exactly one refresh attempt executes per credential. If the refresh fails with invalid_grant, surface a re-authorization signal immediately. Do not retry.
An agent was authorized to read Salesforce records when the user consented. The workflow was later extended to create records. Nobody updated the OAuth consent. The create_opportunity call returns 403. There is no automated recovery. The required scope was never granted. The fix is a new consent flow, not a retry.
OAuth providers return different error codes when refresh operations fail, and each error requires a different recovery strategy. Treating all refresh failures identically — the most common implementation pattern — leads to unnecessary re-authorization requests or repeated failed refresh attempts that compound rather than resolve.
Connected accounts store tokens outside agent runtime; token refresh runs proactively before expiry, not reactively on 401; revocation detection tracks connection state so actions.execute_tool() either succeeds with a valid credential or raises an exception that routes to re-authorization, not a blind retry loop. The connection status API (GET /api/v1/connected_accounts) lets you check auth state before executing critical operations.
60% of all LLM call errors observed across production deployments were caused by exceeded rate limits. Note this is LLM API call telemetry specifically, but the pattern holds at the tool execution layer for the same reason: rate limits compound across parallel agent threads in ways that single-request clients never encounter.
429 with a Retry-After header. The operational error is applying exponential backoff uniformly to all 429 responses without inspecting that header. Some providers include retry_after in milliseconds. Others return 429 with no retry guidance. The correct behavior: parse Retry-After when present; otherwise apply exponential backoff with jitter, max 3 retries per tool call context. Circuit-break after the third retry. Do not propagate the retry loop to the orchestrator layer.400 or 422 and are a signal that the LLM generated structurally incorrect parameters for a tool schema. The correct response is not a retry. The parameters that produced a 400 on the first call produce a 400 on the second. Log the raw parameters the LLM generated, log the tool schema the call was made against, and surface a schema mismatch event for review. Retrying 400s is a source of noise in retry rate metrics and masks the underlying LLM behavior or tool schema problem.HTTP 200), but the write was queued and not immediately committed — or was committed to a buffer that requires a subsequent flush. The signal from the tool call is success. The downstream state is not what the agent expects. Detection requires semantic instrumentation: a post-call state check for data-mutating tools, not just status code logging. For a create_issue tool call, the correct pattern is: after the 200 response, query the resource by the ID returned in the response body. If it is not found or is in a pending state, emit a partial execution event. This adds latency. It is the only way to catch this failure class before it propagates to downstream steps.Aggregate error rate is the least useful signal for agent reliability. It averages across tenants, obscures per-connection degradation, and captures only failures loud enough to produce an error code. These five metrics surface the failure classes above.
A single tenant's revoked credential drops their tool call success rate to zero while the aggregate stays healthy. Aggregate success rate hides this entirely.
Instrument: tool_calls_succeeded / tool_calls_attempted, segmented by connection_id. Alert on any connection_id where the success rate drops below 95% for more than two consecutive minutes.
A declining refresh success rate is the earliest leading indicator of an incoming auth failure wave. Refresh failures accumulate silently; the agent discovers them only when the next expired access token is used in a tool call.
Instrument: token_refresh_succeeded / token_refresh_attempted, with p50/p99 latency segmented by OAuth provider. A latency spike on the token endpoint signals provider-side rate limiting on refresh — a precursor to refresh failures, not a consequence.
Tool calls that returned HTTP 200 but produced no observable state change downstream. This is the hardest metric to instrument and the most consequential to miss.
Instrument: post-call state verification for all data-mutating tools. For every create, update, or delete call, query the affected resource by the ID or key returned in the response. If the state does not match the expected post-call state, emit a partial_execution_detected event. Track: partial_executions / total_write_calls. A non-zero value here is always worth investigating.
Retry rate is useful only when segmented by error class. A high retry rate on expired-token failures means proactive refresh is not working. A high retry rate on malformed parameters means retries are being applied to non-retryable failures. A high retry rate on upstream_5xx with no circuit breaker means cascading failures are already in progress.
Instrument: retry count per tool call, tagged with error class (token_expired, refresh_failed, rate_limited, upstream_5xx, malformed_params). Retry rate on refresh failures and malformed parameters should be zero. If it is not, the retry classification logic has a bug.
If you are consuming connected account lifecycle webhooks, the time between when an auth event occurred and when your agent acted on it is a live risk window. An agent that processes a revocation event 4 minutes after it was emitted has spent 4 minutes executing tool calls against a credential it no longer holds.
Instrument: webhook_received_at - event_occurred_at for all auth lifecycle events. Alert if delivery lag exceeds 30 seconds for revocation or refresh failure event types.
What not to measure: aggregate error rate as a primary agent health signal. It captures only loud failures, averages across tenants, and produces no actionable routing to a specific failure class.
Scalekit's webhooks fire real-time events across three categories: connected account lifecycle changes (account created, authorization completed, account disconnected), auth events (authorization failures, re-auth required, scope changes), and token activity (token refresh succeeded, token refresh failed). These land in your system before the next tool call discovers the failure. Metrics 1, 2, and 5 above are zero-instrumentation-lift when Scalekit manages the agent auth layer.
Detection without a response playbook is still a 2AM page. The decision tree below is deterministic: given a failure class, the correct response is not a judgment call. Retry storms originate almost exclusively from engineers applying the wrong response to a correctly detected failure.
Three rules govern every branch of this tree.
invalid_grant and scope failures are never retried. These are not transient failures. Retrying them generates noise, inflates retry metrics, and delays the only correct action: surfacing a re-authorization signal to the affected user. Every retry on a revoked credential is a wasted call.
400 and 422 are never retried. The LLM generated structurally incorrect parameters. The same parameters produce the same error on the second call. Log the raw parameters and the schema; route to tool schema review; do not retry.
Write retries require an idempotency check first. Before retrying any data-mutating tool call, verify that the previous attempt did not partially execute. Most upstream APIs expose provider-specific idempotency mechanisms: Jira's X-Atlassian-Token, Stripe's Idempotency-Key header, Salesforce's composite request referenceId. Use the provider's native mechanism, not a generic key, and verify downstream state before issuing the retry. A retry on a non-idempotent create that is already partially committed produces a duplicate.
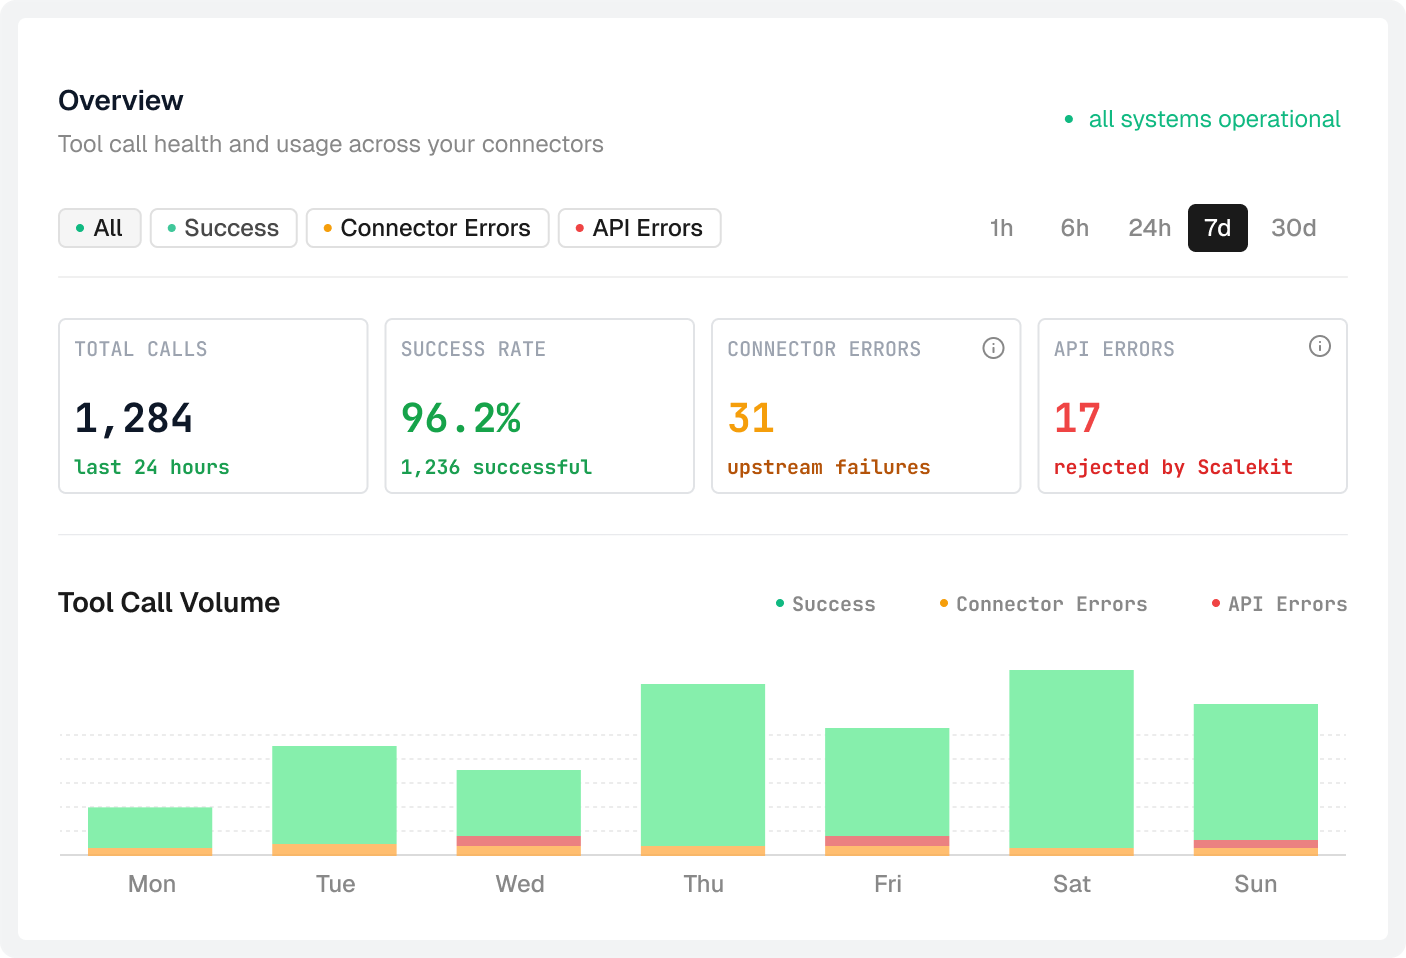
Datadog and Grafana observe the execution plane: HTTP status codes, latency, throughput, retry rates. They do not observe the identity plane: refresh failures, revocation events, scope changes, tenant disconnections. These are two independent telemetry streams. Most teams instrument only one.
Failures that originate in the identity plane are invisible to execution plane telemetry until they surface as tool call failures — which is the moment of maximum operational impact, not the earliest detectable moment.
The auth events that must reach your observability stack before go-live:
The documented Scalekit webhook payload structure uses "type", "object", "occurred_at", "environment_id", and "organization_id" as top-level fields, with event-specific data in the "data" field. Index connection_id, occurred_at, and the event "type" as the dimensions your alert rules filter on. Verify webhook signatures using the Scalekit SDK before processing any event payload.
Alert 1: Token refresh failure sustained
A sustained refresh failure means the agent will rediscover it as a 401 on every subsequent tool call until the credential is re-authorized. This alert fires before the tool calls fail, not after.
Alert 2: Connected account disconnected for an active workflow
This alert should fire within 30 seconds of the event. The gap between a disconnection event and the agent discovering it on the next tool call is an unconstrained failure window. Every tool call executed during that window fails; every one of those failures was preventable.
SIEM is security event correlation and compliance audit. Auth event observability for agents is an operational concern: it drives workflow pause logic, re-authorization notifications, and retry suppression. The same event stream serves both purposes, but the alert rules and response playbooks are different.
A connected_account_disconnected event is a P2 operational incident for the agent platform and a medium-severity audit event for the security team. These go to different channels and trigger different responses. Routing both through a SIEM adds latency and buries the operational signal behind severity thresholds tuned for breach detection, not workflow reliability.
Route auth events to your observability stack first. Forward a copy to SIEM for compliance retention. Operational alert rules need sub-60-second delivery. SIEM ingestion pipelines are not designed for that SLA.
The agent's orchestrator observes the tool executor's response, not the upstream API's response. If the connector returns 200 after swallowing an auth failure internally (a common pattern in retry-on-failure middleware), the orchestrator has no signal that the action failed. Add semantic verification — post-call state checks for write operations — and ensure connector-level errors surface as typed exceptions rather than swallowed into empty responses.
By the OAuth error body, not the HTTP status. Both return 401. Expired access tokens produce error: "invalid_token" in the response body. Revoked refresh tokens produce error: "invalid_grant" (RFC 6749, Section 5.2). Parse the error body. If you are using Scalekit, check connected_account status via the API — if the account is in an error state, re-authorization is required.
No. Exponential backoff applies to transient failures: 429, 500, 502, 503. It is incorrect for invalid_grant (the token will still be revoked 30 seconds later), 403 scope failures, and 400/422 malformed parameters. None of these are transient. Retrying them generates noise and delays the correct remediation.
Use distributed locking on the refresh operation, keyed by connected_account_id. Acquire the lock before attempting a refresh. If the lock is held, wait for the holder to complete, then read the updated token from the store. Do not attempt a parallel refresh. If your auth layer runs through Scalekit, refresh coordination happens at the infrastructure level via the connected account model — your agent threads call actions.execute_tool() and always receive a valid token regardless of concurrency.
Circuit-break at two retries within a 60-second window. Emit an upstream degradation event tagged with the provider and connected_account_id. Halt the affected workflow step. Do not propagate the retry loop to the orchestration layer. Queue the step for resumption when the provider recovers — poll the provider's status endpoint or subscribe to their status page feed if available.
This is the partial execution case. The detection gate is a post-call state check: query the resource by the ID returned in the response body and verify the expected state. Before retrying, confirm the upstream API exposes a provider-native idempotency mechanism (such as X-Atlassian-Token for Jira or Idempotency-Key for Stripe). Pass a stable key — one that does not change between retry attempts — and verify downstream state before issuing the retry. If the API does not support idempotent writes, halt and route to human review rather than risk a duplicate action.