Agent Tool Observability: Your Agent Is Running. Is It Actually Working?


Agent observability is straightforward if your agent makes one tool call to one API on behalf of one user. Log the request, log the response, alert on errors. Done.
Production agents don't look like that. A single user action triggers a sequence of tool calls across multiple connectors. The sequence is decided at runtime by the model. The same prompt produces different call chains on different runs depending on what context the model has available. And the same agent runs concurrently for many users, each with their own connected accounts and credentials.
At that scale, the monitoring patterns that work for REST APIs stop working. This launch blog covers why, what agent tool observability actually requires, and what we shipped in AgentKit to address it.
The core problem: non-deterministic call paths
With a conventional API, debugging a failure is manageable because the call path is known in advance. You have an endpoint, a set of expected inputs, and a defined response contract. When something breaks, you can reproduce it, write a test, and add an alert.
An agent's tool call sequence has none of those properties. The model selects tools based on reasoning over the current context, and that context changes on every run: different conversation history, different state in connected systems, different results from earlier tool calls in the same sequence. The same user instruction can produce a different tool call sequence each time it runs.
This means when a tool call fails inside an agent workflow, you are not debugging a broken endpoint. You are debugging a specific moment inside a dynamic sequence that may not repeat. The failure has context: what the agent had already done, what it was trying to do, what it expected to receive. Without that context, the error message alone is rarely enough to act on.
Two categories of failure that require different responses
When a tool call fails, the failure originates in one of two places, and they are not the same problem.
The first category is failures that occur before the call reaches the external connector. The agent runtime constructed the tool call, but something was wrong before it left: an expired credential, a missing required parameter, a connector that was never properly configured. The tool call never touched the external API.
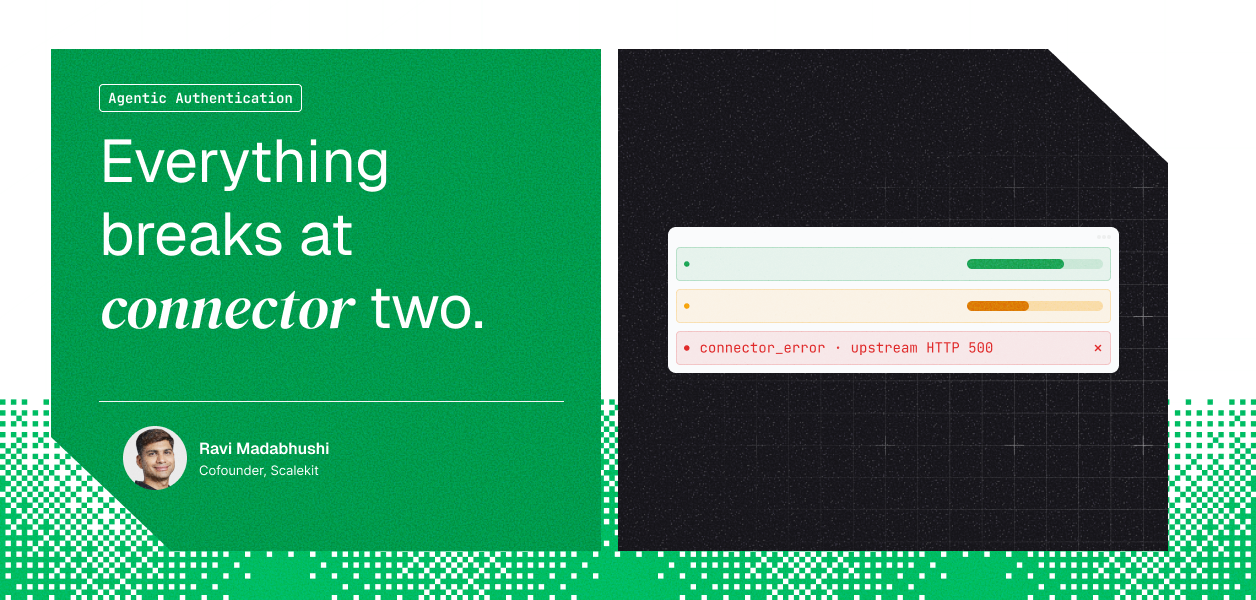
The second category is failures at the connector itself. The call left successfully, reached the external API, and the API returned an error: an HTTP 500 from HubSpot, a scope the user never authorized, a rate limit on the Salesforce API. These are upstream failures. The agent infrastructure did its job; the external system didn't.
These two categories have different owners and different fixes. A credential expiry is something your infrastructure should have caught and refreshed. A HubSpot HTTP 500 is HubSpot's problem, and the right response is a retry or a user notification. Collapsing them into a single "tool call failed" category means triaging from scratch every time. For a deeper look at how these patterns compound in production, see Agent Tool Calling Auth: Production Problems, Patterns, Anti-patterns.
What production agent tool observability requires
Given these properties, useful agent tool observability needs three things that standard API monitoring doesn't provide by default.
Connector-level health, not just agent-level health. An agent can appear to be running normally while one of its underlying connectors quietly degrades. If a connector's success rate drops from 98% to 85%, the aggregate agent health metric may barely move, but a specific class of user actions is silently failing. You need per-connector success rate, error rate, and call volume tracked over time, filterable to a single connection.
Explicit separation of connector errors from infrastructure errors. Every tool call failure should be classified at the point it occurs. Did the call fail before it left the platform, or did the external API return an error? The classification and the reason should be immediately visible without requiring you to dig through raw logs.
Per-call trace with user identity. Aggregate error rates tell you something is wrong. They don't tell you which users are affected, which specific calls failed, or what the downstream consequence was. Each tool call needs a traceable record: who triggered it, which connection resolved the credential, which tool was called, how long it took, and the full error detail if it failed. The user identifier in each record is what makes it possible to answer "who was affected" without cross-referencing multiple systems.
What we shipped in AgentKit
AgentKit now includes tool call observability across all connectors in the platform.
The overview dashboard shows total calls, overall success rate, connector error count, and API error count, with time windows from 1h to 30d. You can scope the view to a single connector. The intent is to surface connector health degradation before users report it.
The error breakdown separates connector errors from API errors with the reason attached. A connector error means the call reached the external API and failed there. An API error means the call was rejected before it left Scalekit: invalid parameters, expired token, misconfigured tool. Each recent failure shows the connector, the tool, and the reason in one row.
The tool call log is a full execution history. Every call is recorded with timestamp, connection, tool name, user identifier, and latency. Clicking into any row surfaces the complete record: connector, connection name, connection ID, account ID, tool, identifier, timestamp, duration, source, and for failures, the error code and full error message.
To make the error classification concrete: a recent failure in our own environment shows grainmcp_create_clip failing with INTERNAL_ERROR and the message Recording not found or not accessible. The call reached Grain and Grain returned the error. The credential was valid, the tool was correctly configured, and the call was properly formed. The issue is that the recording ID the agent passed doesn't exist or isn't accessible to that user in Grain. That is a different debugging path than an expired token or a missing scope, and the classification makes it immediately clear.

The identifier field on every log record stores the identity of the user who triggered the tool call, not the agent process or a service account. In a multi-tenant product where a single agent runs for many users simultaneously, this is what makes it possible to answer "which users were affected by this failure" without joining across multiple data sources.
What changes in practice
Without tool-level observability, the sequence starts with a user report: something didn't work, the agent didn't update the record, the action didn't complete. You then work backward through logs to reconstruct what happened.
With it, the sequence can start from the data. Error rate on a specific connector rises, you open the tool call log filtered to that connector, find the failures with their reasons, and have enough information to act before any user has noticed. The user-level identifier means you can also proactively communicate to affected users rather than waiting for them to reach out.
The tool call log and overview dashboard are available now in AgentKit for all connectors in the platform.